
简介
2025 年标志着加密货币市场从“宏观情绪”驱动因素到“合规和微观结构”驱动因素的范式转变。尽管全球降息,但“降息=牛市”的线性逻辑失败了,取而代之的是深刻的结构分化。 BTC 与科技股表现出高度相关性,而 RWA 和稳定币则作为新的流动性储备而飙升。随着定价权从风险投资转向二级市场以及链上衍生品重塑交易,本报告分析了2025年的流动性格局,并预测2026年将出现以机构定价为主的“结构驱动”周期。
摘要
2025 年标志着加密市场从“宏观情绪驱动”到“微观结构和合规驱动”的范式转变。尽管全球进入降息周期,但市场并未出现广泛反弹。相反,它表现出了深刻的结构分化。
- 宏观逻辑重构:加密资产与风险资产表现出更高的相关性。“降息=牛市”的线性逻辑在2025年失败了。在宏观不确定性的背景下,加密资产表现出与美国科技股的高相关性(高Beta)而非独立的避险属性。传统机构持有资产的意愿增强,ETF等机构取代散户成为市场的边际定价锚,显着提高了宏观波动向加密市场的传导效率。
- 链上新蓄水池:RWA在零和博弈中突围。在全网TVL仅小幅增长+4.40%、代表存量流量博弈(现有流动性竞争)的环境下,RWA/稳定币板块实现了+133%的爆发式增长,以$9.42B净流入排名第二。稳定币正在加速从纯粹的“交易结算工具”向“国库收益”和“商业支付(PayFi)”基础设施的溢出效应,成为新的流动性压舱石。
- 一级市场估值反思:定价权让渡给二级市场。融资节奏表现出明显的滞后性,只有在宏观确定性确立后,融资金额才会出现 V 型反转(Rootdata 显示 10 月份融资额为 $3.6B,而第二季度为 $2.25B,第三季度为 $3.12B)。上半年,高达27.59%的项目出现“估值倒挂”,迫使市场在下半年通过头部交易所新的代币机制(如Alpha模式)进行强制回调。定价权已彻底从风险投资叙事转向二级市场流动性。
- 微观结构分层:衍生品主导与马太效应。二级市场呈现“稳健指数、流血长尾”的特点。 BTC和稳定币市场份额持续扩大,山寨币流动性在合规审查中面临枯竭。合约(期货/永续合约)交易占比大幅提升。以Hyperliquid为代表的链上衍生品正在重塑交易格局,但也暴露出高杠杆下的流动性脆弱性(例如10.11闪崩)。
- 2026年展望:迈向“结构驱动”新周期。市场关键变量将从“降息幅度”转向“合规资本传导效率”。随着GENIUS法案等框架的实施,市场将进入以机构定价权为主导的“结构驱动”时代。在合规框架内能够提供实际收益和金融基础设施价值的资产将是跨周期的核心目标。
I。宏观范式重构:资产属性修正与流动性传导阻塞
1. “数字黄金”还是“高贝塔科技股”?
1.1市场表现:宏观预期与资产表现的背离
2025年是加密资产宏观定位的结构性转折点。尽管主要经济体相继进入降息周期,但受制于宏观流动性依然大幅偏紧,市场缺乏增量资金支撑,并未退出预期的普遍上涨。
相反,美联储确认降息后,市场表现出明显的“出售事实”效应。比特币价格从 2025 年 10 月的峰值 12.6 万美元回落至 12 月中旬的约 8.6 万美元,整体市值缩水约 25.00%。相比之下,金价今年迄今(截至 12 月中旬)上涨了 65% 以上,创下了十年来的最佳表现。这种资产表现的巨大分化,印证了加密货币市场正在经历深刻的微观结构调整和宏观逻辑重构。
1.2 结构演变:定价的制度迁移霸权
范式从散户驱动转向机构配置:2025 年,ETF 资金流确立了市场边际定价锚的地位。根据 CoinShares 的2025 年机构加密货币报告,加密 ETF 的年度净流入达到 $59.5B。与此同时,散户的定价影响力明显下降。从Coinbase机构披露的年度和季度数据来看,机构投资者在交易量上占据主导地位,机构交易量维持在总交易量的80%左右。 2025年,链上“零售参与热”并没有同步加强。这种结构性变化显着提高了加密资产价格形成机制对宏观流动性、利率和机构配置行为的敏感性,而不是由情绪驱动的零售交易所主导。
1.3宏观逻辑:货币政策传导机制受阻——“降息=加密牛”线性逻辑失败
在衰退预期不断升温的背景下,2025 年的三次降息(9 月、10 月、12 月)将利率从 4.5% 降至 3.75%。但流动性并未有效转化为风险资产的买入压力;相反,它暴露了比特币当前的属性是风险资产而不是避险资产。尽管货币政策释放了流动性,但受美国财政赤字扩大、关税政策不确定性以及地缘政治摩擦等因素制约,避险资金优先回流至美国国债和黄金。加密资产处于宏观流动性分布的末端,未能捕获避险资本的主要溢出。
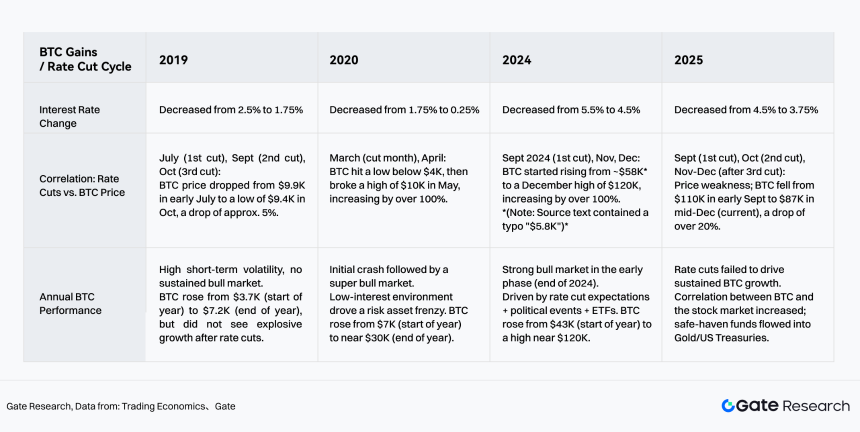
图1:过去5年降息周期与BTC相关性变化
来源: 门,贸易经济学
2流动性结构重塑:机构主导下的定价逻辑与叙事分歧
2.1 买方结构:机构持股量大幅增加
随着全球监管框架的明确(如美国GENIUS法案、欧盟MiCA实施)以及ETF渠道的成熟,加密市场正在加速脱离早期无序扩张阶段,进入合规配置时代。 AIMA 2025 年调查显示,在接受调查的 122 家机构投资者和对冲基金经理中,传统对冲基金的配置意愿显着增强——持有加密资产敞口的比例从 2024 年的47%攀升至 2025 年的55%(AIMA,第七届年度全球加密对冲基金报告,第 7 页)。这些数据表明,合规路径的清晰性正在推动传统资本从观察转向实质性配置。
Gemini在与Glassnode发布的2025加密货币市场回顾中明确指出,ETF流入和流出与BTC价格走势密切相关,资金流入超过4B美元带动价格上涨高达35%。
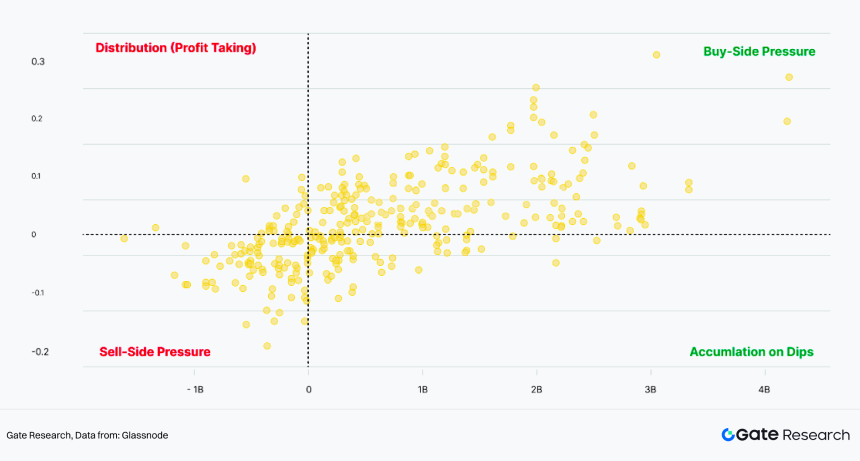
图表2:ETF流量与价格表现(7天)
来源:Glassnode
2.2宏观逻辑的阶段性变化:加密资产表现出更高的风险资产相关性
相关性变化:随着传统金融资本的深度介入,BTC与纳斯达克指数的6个月相关性在2025年9月达到0.92。2025年12月上旬,BTC与标普500指数(30日均线)的相关性飙升至0.5-0.88,而与黄金的相关性为0.19。比特币与美股风险资产的相关性水平明显高于传统避险资产(如黄金)。这一现象表明,在当前宏观环境下,加密资产价格表现更接近高Beta风险资产特征,而非稳定的避险工具。
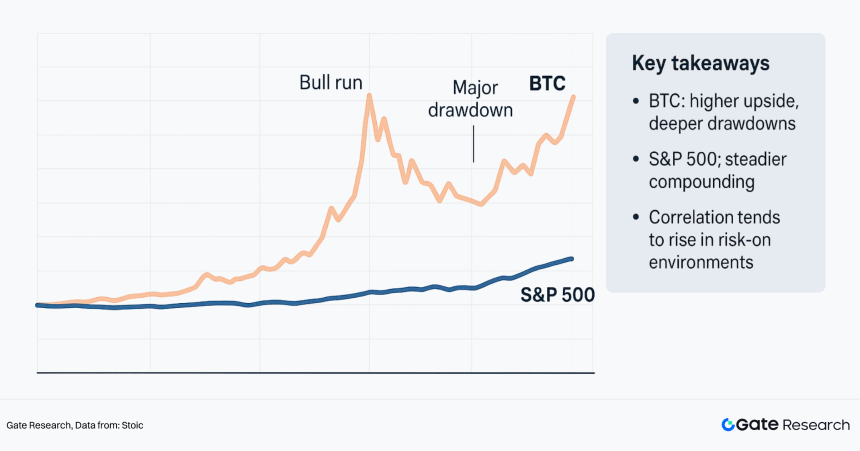
图3:比特币与标准普尔500指数表现
来源:斯多葛派
2.3 叙事分歧:人工智能主题的内生差异
虽然都属于高风险资产,但加密货币市场的“AI+Web3”叙事与美股AI板块表现出显着的弹性差异。美股人工智能上涨是由技术突破和企业盈利(例如英伟达财报)推动的,并有坚实的基本面支撑;而加密货币市场的人工智能叙述大多仍处于概念验证阶段,缺乏实质性的生产力转换和定义的商业模式。在宏观流动性收缩周期中,缺乏盈利支撑的加密AI项目难以吸引注重确定性的机构资金,导致其业绩远远落后于纳斯达克指数。
3 增量逻辑和新兴部门:新的储层流动性
3.1宏观背景下的流动性分层:零和博弈与增量流入
就现状而言,必须强调的是,政策降息并不等于全面放松金融状况。受财政赤字、信用风险溢价和监管约束等因素影响,实际可配置风险资产的增量流动性仍然有限。同时,全网链上资金的沉淀逻辑也发生了变化。
截至2025年11月20日,全网TVL年增长率仅为+4.40%(较2024年的+120.3%大幅放缓),标志着市场进入存量博弈(零和)阶段。然而,在加密货币行业整体流动性稀缺的表面之下,RWA/稳定币行业却走出了独立的“阿尔法”趋势。
- 逆势高增长:RWA/稳定币行业在 2025 年 TVL 增长率达到 133%,成为市场上增长最快的行业,与 Dexs (-21%) 和 Bridges (-19%) 的萎缩形成鲜明对比。
- 资金储备:从净流入规模来看,虽然Lending以$16B位居榜首(主要是现有资金杠杆需求拉动),但RWA板块以$9.42B净流入规模位居第二。这标志着RWA已经取代纯粹的DeFi协议,成为外部增量资金进入加密市场的首选“锚点”。
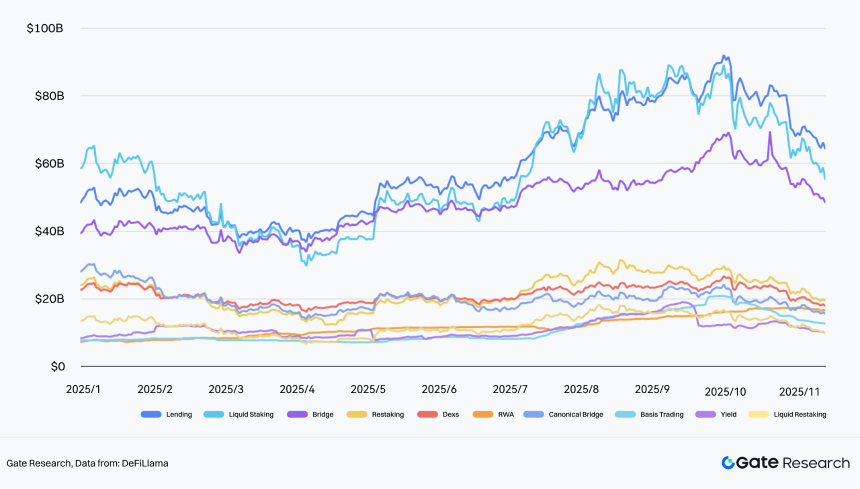
图4:十大追踪流动性TVL变化和净流入
来源:DeFiLlama
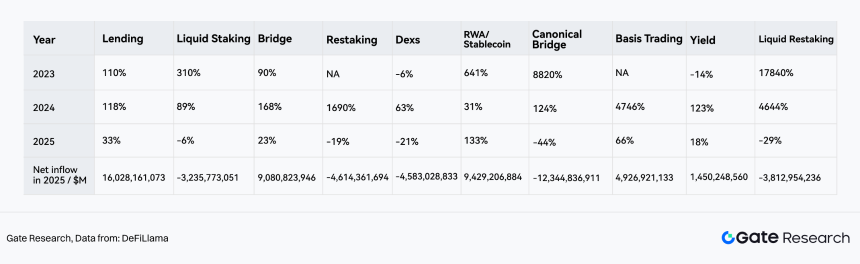
图5:2023年至2025年十大追踪流动性TVL变化(从左到右,按TVL绝对值排序从最高到最低)
来源:DeFiLlama
3.2 场景重构:从“交换媒介”到“PayFi”基础设施
根据 BCG 咨询报告稳定币:衡量其潜力的五项杀手测试,2024-2025 年稳定币的总交易量达到$26.1T。尽管“加密资产交易结算”仍以 92% 的份额占据主导地位,但最快的边际增长来自于与现实世界的融合,分为两类:
- 支付:份额上升至 5-6%(约 1.3T 美元),标志着稳定币从投机工具向全球支付网络的转变。
-
RWA/国债(代币化资产):份额为3%,代表链上资金对美国国债无风险利率的刚性需求。
三大支柱(交易、支付、RWA)的形成,意味着稳定币打通了B端机构结算和C端实际消费之间的循环。
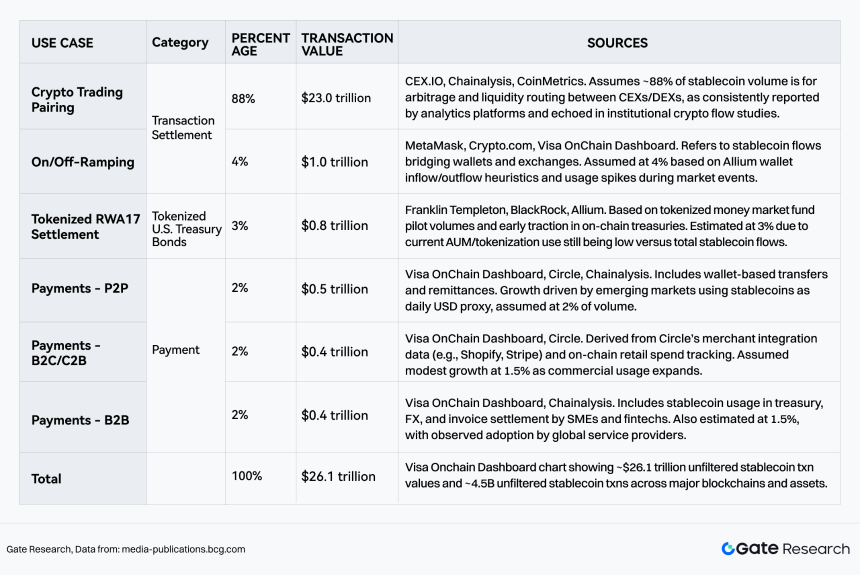
图6:2024-2025年稳定币交易价值和交易笔数细分
来源:BCG
3.3支付行业微观洞察:机构主导地位与链上分层
稳定币支付正在重塑全球清算系统。安永(EY)预测,到2030年,稳定币将承载全球支付流量的5%-10%。 Artemis数据进一步揭示了当前的增长结构:2023-2025年累计支付结算量达到$136B,其中B2B和机构卡业务占据绝对份额80%,成为推动这一增长的核心引擎。随着Stripe收购Bridge等标志性事件的完成,机构支付正式从“链上实验”走向“商业常态”。
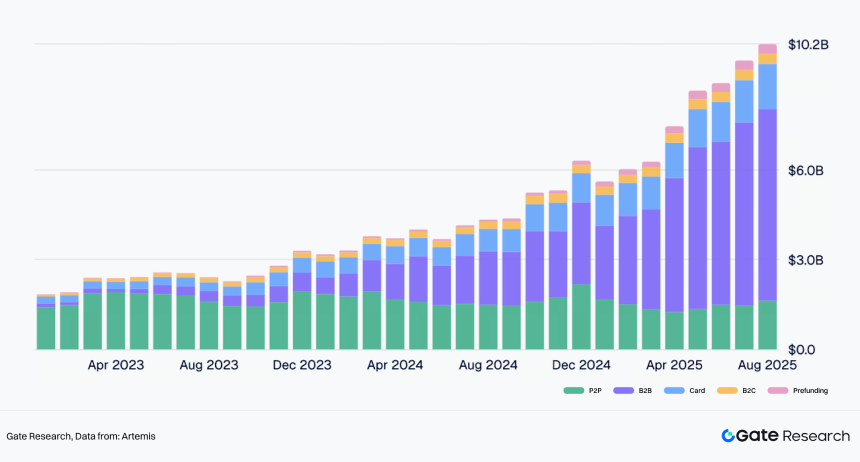
图7:2023年至2025年稳定币支付类型变化
来源:阿耳忒弥斯
Artemis数据显示,稳定币支付呈现出明显的“双轨”特征:
- B2B 大额结算(Tron 和以太坊):
- 增长趋势:月交易量从 2023 年初的不到 1 亿美元飙升至 2025 年中期的 6B+ 美元。
- 链上偏好:机构大额转账明显偏爱流动性深厚、安全性高的以太坊和波场网络,平均交易价值超过 219,000 美元。这反映出在商业结算场景中,资金安全和网络共识优先于低Gas费。
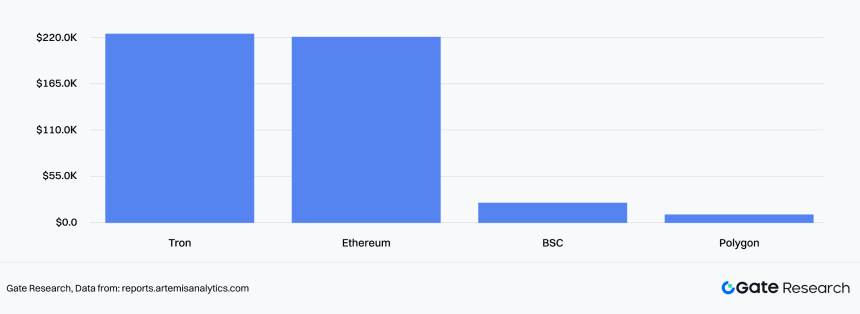
图8:Blockchian的平均B2B交易规模
来源:阿耳忒弥斯
- C 端消费者支付(卡支付和高频支付):
- 增长趋势:与稳定币绑定的加密卡月交易量突破 $1.5B。
- 链偏好:主要是美国信用卡系统在以太坊 L2 和高性能链(如 BSC/Polygon)上的小额高频渗透,平均单笔交易在 40-90 美元,覆盖日常消费场景。
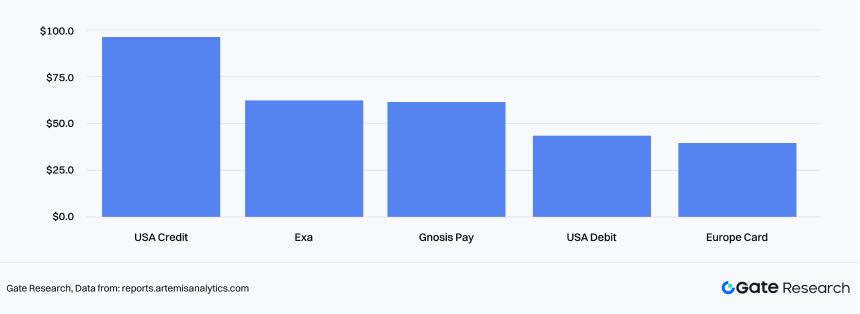
图9:按卡类型划分的平均卡交易规模
来源:阿耳忒弥斯
3.4 竞争格局:合规与合规的博弈产量
2025年,稳定币市场的竞争维度从单一的“流动性之争”升级为“合规”和“收益能力”的多维博弈。总规模从年初的$200B稳步攀升至$300B+,呈现出“百花齐放”的景象:
- 巨头的护城河:USDT 继续保持增长,市场份额达 47.5%,但其主导地位面临挑战。
- 合规新力量:受益于Circle的IPO计划和利好政策,USDC持续稳定增长,市场份额达到34%; PayPal 的 PYUSD 正在以 270% 的增长率快速渗透传统金融渠道。
- 收益创新:USDe(中性套利策略)和BUIDL(贝莱德国库基金)分别实现了66.9%和623%的爆发式增长。这表明,在降息周期开始之前,市场对“链上收益资产”极度渴求。
- 未来展望:随着美国天才法案的推进以及富达等传统资产管理巨头的加入,稳定币将不再局限于法币渠道,而是将演变成具有“多链互操作性”和“内生收益”的全球基础货币层。
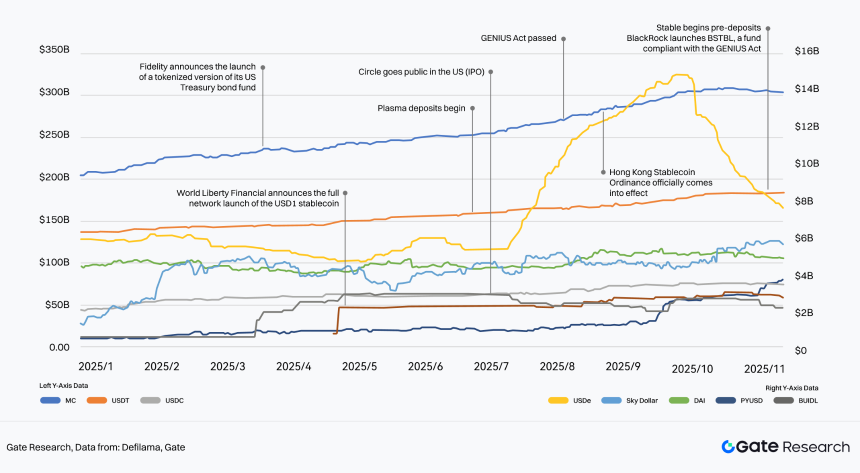
图10:2025年主流稳定币增长
来源:DeFiLlama,门
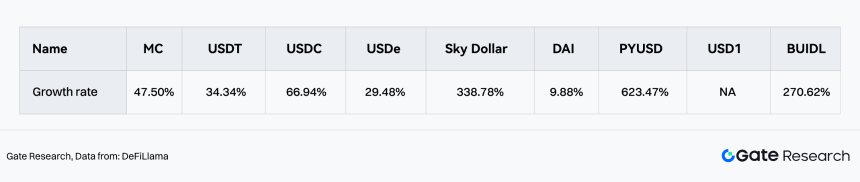
图11:2025年稳定币规模增速
来源:DeFiLlama
II.一级市场:资金流动滞后与“流动性主导重塑”
1.融资节奏:从“追价”到“确认宏观”
2025年,一级市场投资金额和市值水平波动,呈现明显的脱钩和滞后特征。
- 相关性弱:风险投资活动与 BTC 价格趋势不同步。在BTC Q2-Q3创新高期间,一级市场融资并未明显扩张(Q2 $2.25B / Q3 $3.12B),反映出宏观不确定性下机构资本的避险倾向。
- 确定性溢价:宏观“启动下降”后发生大规模资本回报。随着降息预期逐渐明朗,仅 10 月份融资就飙升至 $3.6B,超过 Q2 或 Q3 的总和。这一数据表明,一级市场的核心决策因素从简单的“二级价格FOMO”转向“宏观确定性”和“监管清晰度”的确认。
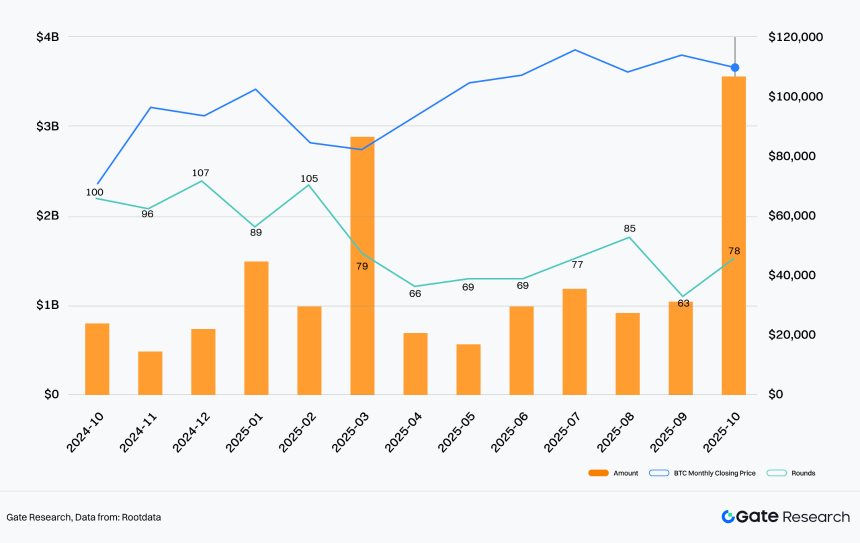
图12:月度分析:加密货币市场融资规模、轮次和比特币价格变化
来源:根数据
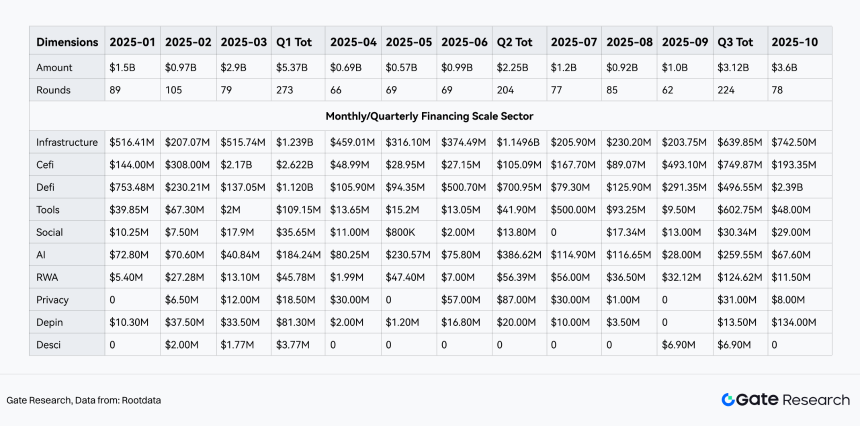
图 13:2025 年加密货币行业月度/季度融资规模
来源:根数据
2.估值体系演进:从“VC定价失败”到“流动性主导重塑”
2025年一级市场的显着特征是估值体系的剧烈波动和重构。数据显示,一级市场经历了从上半年“估值倒挂(定价失败)”到下半年“交易所主导修复(强制重新锚定)”的完整周期。
2.1现象:结构性“估值倒挂”与“泡沫出清”
在估值数据统计完整的58个TGE项目中,有16个项目(占比27.59%)出现了“融资估值>初始FDV”的估值倒挂现象。这意味着近三分之一的一级市场标的上市首日就面临“盈亏平衡”风险,表明一级市场定价体系存在系统性失灵。
- 热点区域:倒挂现象集中在基础设施(Infra)、人工智能、公链和 DeFi 领域。这些项目普遍存在“融资数据表现不佳”、缺乏“顶级VC背书”的特点,导致在缺乏流动性支持的二级市场上价值快速重估。
- 退出路径受阻:数据显示,估值倒挂的项目无论是否参与新币活动(Alpha机制),后续在顶级交易所主板上市的概率极低。这表明“估值倒挂”往往是项目基本面疲软的先行指标。
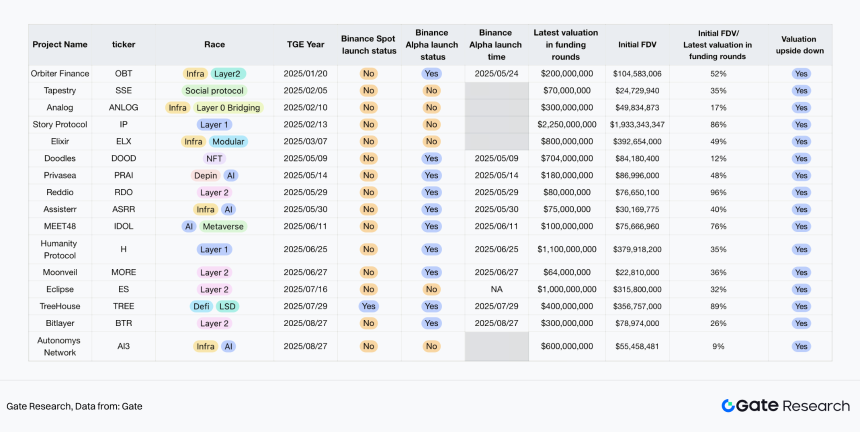
图14:2025年TGE项目项目样本
来源:Gate
2.2归因分析:BTC价格与交易机制的双重影响
一级市场的定价效率与宏观环境(BTC价格)和市场微观结构(交换机制)呈现出显着的时变相关性。
A. 1-4月:定价基准失效(干预前阶段) 顶级交易所新上线机制推出前,一级市场定价主要受Macro Beta影响。
- 2月极端行情:除2月份市场普遍崩盘导致项目被动倒挂外,1-4月倒挂情况整体并不明显。此时的市场处于“无锚定”状态,定价权掌握在早期VC手中,缺乏强制修正机制。
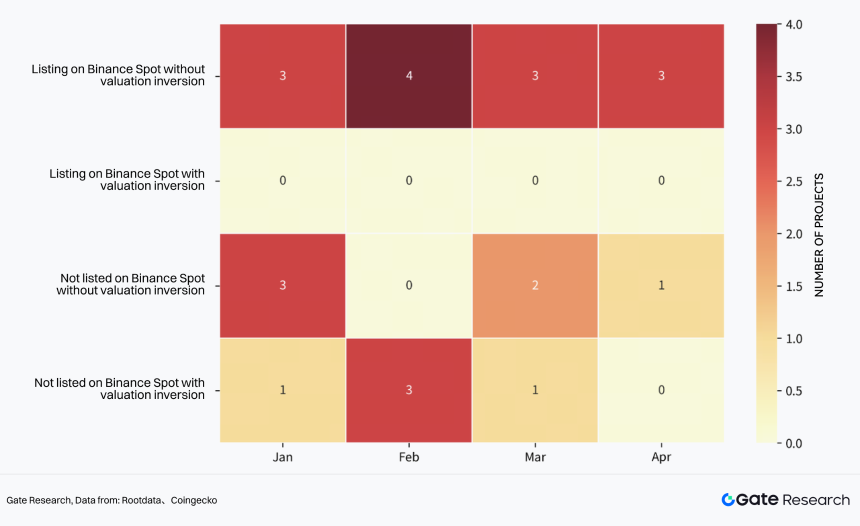
图15:TGE后估值反转分布热图(2025年1月-4月)
来源来源:Rootdata、Coingecko
B. 5月-11月:交换机制下的“强制重锚”(干预后阶段) 5月是一个关键的分水岭。随着头部交易所推出新的上币机制(阿尔法机制),市场定价逻辑被强力重塑,呈现出两个截然不同的阶段:
-
第一阶段:人为制造“价值压抑”(5月-6月)为了激活流动性,平台在机制实施初期采取了激进的“FDV抑制”策略。
- 数据验证:5-6月该机制下挂牌的项目,首轮FDV/融资轮估值平均比率被压缩至95%,导致期间估值倒挂率飙升至50%以上。
结论:** 这是重建二级市场信任的“休克疗法”。虽然牺牲了初级投资者的短期账面回报,但成功挤出了泡沫。
- 数据验证:5-6月该机制下挂牌的项目,首轮FDV/融资轮估值平均比率被压缩至95%,导致期间估值倒挂率飙升至50%以上。
-
第二阶段:估值泡沫再度膨胀(7月-11月)随着8月份BTC价格回升以及市场适应新机制,政策限制开始放松,估值快速反弹。
数据验证:7月之后,估值倒挂现象基本消失。 9月份BTC价格上涨后,初始FDV/融资估值比在200%-1000%范围内的项目重新占据主导地位(占比70%+)。 疯狂倍数:7月至11月,该比率平均值惊人反弹至857%。一些热门项目(例如 $2Z、$MMT)的初始 FDV 较上次融资估值上涨了 15 倍以上。这标志着在初级融资枯竭的背景下,资本疯狂追逐一些确定的顶级TGE目标,形成新的局部泡沫。
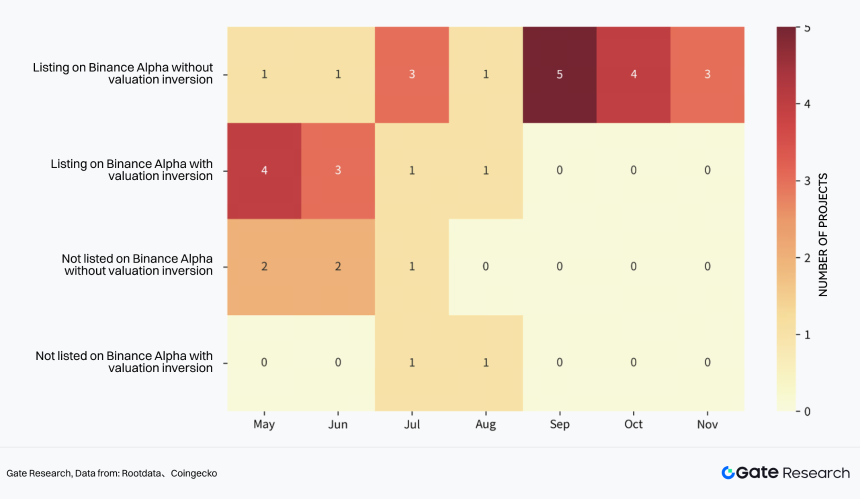
Chart 16: Heat Map of Post-TGE Valuation Inversion Distribution (May-November 2025)
Source From:Rootdata, Coingecko
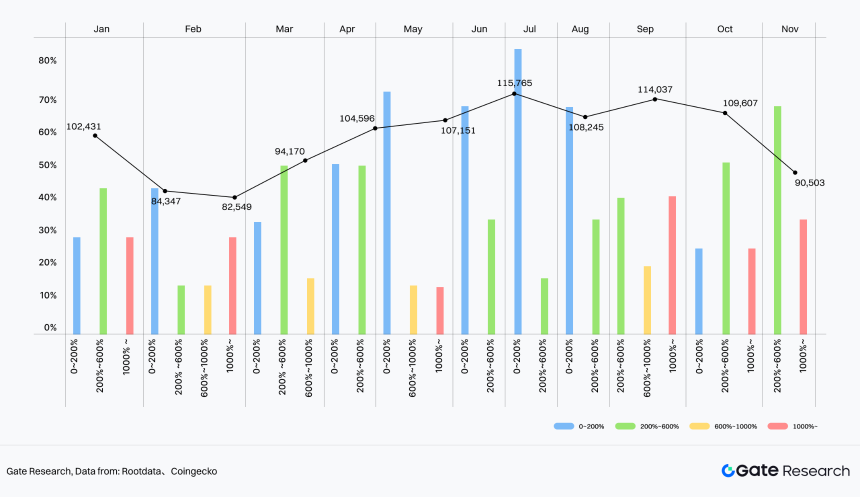
Chart 17: Monthly Change in Initial FDV / Last-Round Valuation vs. BTC Price
Source From:Rootdata, Coingecko)
Data Insight: The inversion in the first half was mainly triggered by the extreme market in February, when the market had not yet established effective pricing correction mechanisms.
2.3 Conclusion: The transfer of pricing power
The valuation data of 2025 reveals a brutal reality: The pricing power of the primary market has been deeply ceded to secondary liquidity channels.
- When exchanges needed to create a wealth effect (May-June), primary valuations were compressed by the market into inversion;
- When macro sentiment warmed and compliance channels opened (after August), the premium capability of the secondary market (857%) far exceeded VC imagination. For future investors, judging whether a project’s valuation is reasonable is no longer about “how much money was raised,” but whether it fits the cyclical pricing window of the “Exchange New Token Mechanism.”
The data for this chapter is up to: The financing and valuation sample is up to November 11, 2025; the screening date for the token economics sample is December 4, 2025.
3 Tokenomics Evolution: Structural Differentiation on the Supply Side
3.1 Macro Characteristics: Rigid Unlocking Models vs. Mutant Distribution Structures
Based on statistics from 50+ hot new TGE projects in 2024-2025 (Current FDV > $10M), we found:
- Unlock Model Inertia: The market is still dominated by the “Cliff + Linear” model. The average unlocking period for investors and teams remains over 3 years, and in 57% of projects, the unlocking terms for both are exactly the same (deeply bound). This means supply-side pressure from early stages has not been alleviated through mechanism innovation.
- Structural Mutation: The real game takes place in “Initial Circulation Ratio” and “Benefit Distribution Structure.” Different sectors have taken completely different distribution paths based on their own survival logic.
3.2 Sector Differentiation: Micro-Games in Seven Major Sectors
Token allocation is no longer just a numbers game, but a reflection of the different trade-offs between “Capital Dependency” and “Community Consensus” in each sector.
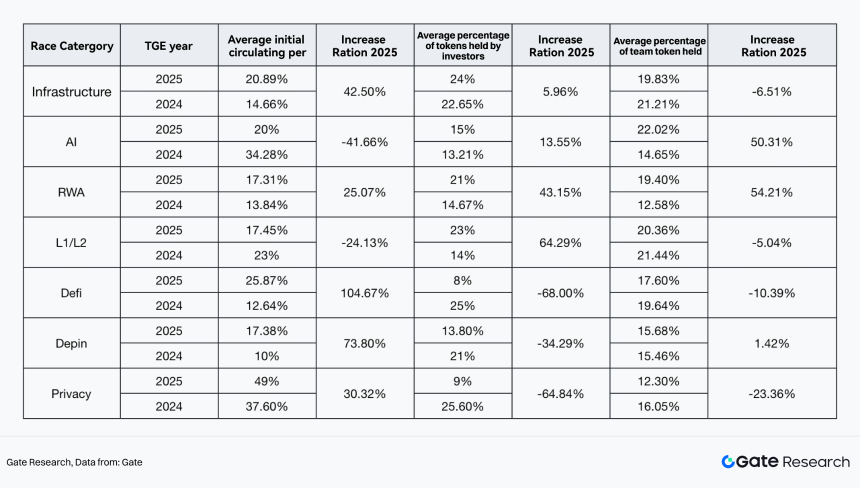
Chart 18: Changes in TGE Token Distribution for 7 Major Segments in 2025
Source From:Gate
Analysis of over 50 hot new TGE projects from 24-25 across seven core sectors (Infrastructure, AI, RWA, L1/L2, DeFi, DePIN, Privacy) follows:
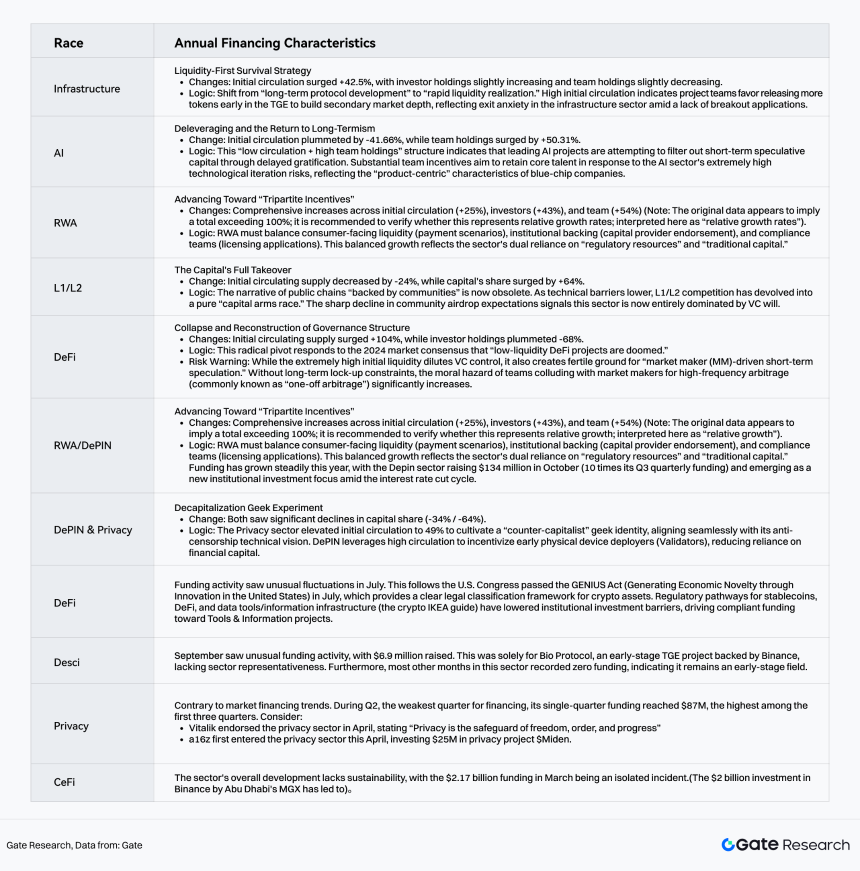
Chart 19: Analysis of the Current Status of the Major Industry Segments in 2025
Source From:Gate
3.3 Chapter Summary
Looking at all sectors, the evolution of tokenomics is essentially “Redistribution Rebalancing under a Zero-Sum Game.” Regrettably, we have not seen mechanism innovations similar to the DeFi Summer era (like VeModel). Current adjustments are more of a zero-sum game between projects “appeasing the community” and “satisfying investors.”
4. Annual Narrative Evolution: The Profit-Seeking Map of Capital Flows
The market narrative in 2025 showed clear quarterly rotation characteristics. Capital no longer blindly flooded all sectors but switched rapidly between different sectors based on “ROI” and “Mindshare.”
ROI: Benchmarked against the market capitalization at the beginning of the year, this calculates the relative growth of a specific sector at the current time to reflect its investment return efficiency. Formula: (Current Market Cap - Market Cap at Start of Year) / Market Cap at Start of Year × 100%.
Mindshare: Characterized by the share of total discussion volume related to a specific narrative on platform X within a specific timeframe, reflecting the market attention and influence of that narrative. Calculated using the Dexu platform’s proprietary methodology and data.
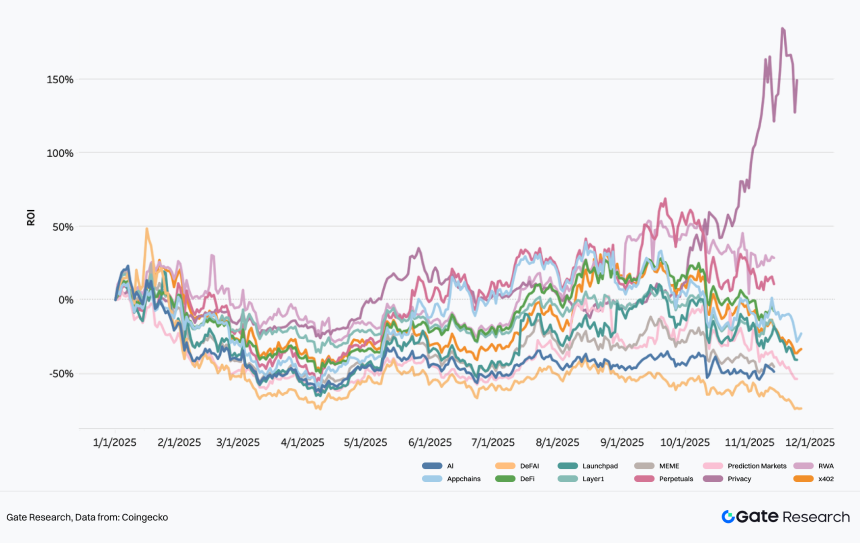
Chart 20: ROI Trends of Hot Sectors in 2025
Data Source:Coingecko
Insight: The window period for excess returns in sectors is shortening, and the speed of capital migration from one hotspot to the next has significantly accelerated.
4.1 Q1: Independent Rally of AI Financialization (DeFAI)
- Keywords: Strong Financial Attributes, AI Meme Continuation
- Performance: Carrying over the heat from late 2024, DeFAI led Q1 with 8.02% Mindshare.
- Logic: DeFAI successfully translated the technical narrative of AI into tradable financial assets, fitting the crypto capital preference for high volatility and high concepts. The sector’s high point ROI touched 48.56%, significantly outperforming the broader market
Market sentiment in the AI sector continued the AI Meme frenzy from late 2024, reaching a Mindshare of 8.02%. DeFAI became the focal point of the quarter and led the rally due to its strong financial attributes that highly align with the crypto space, touching a peak ROI of 48.56% and significantly outperforming other sectors.
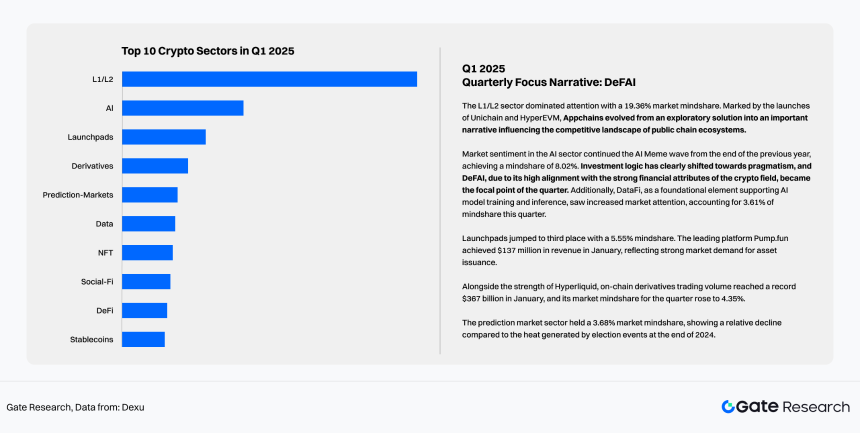
Chart 21: Top 10 Crypto Sectors in Q1 2025
Data Source:Dexu
4.2 Q2: Renaissance of Launchpads (Meme Launchpads)
- Keywords: Traffic Monetization, Pump.fun Effect
- Performance: Sector ROI rose against the trend by 38.75%.
- Logic: Under the demonstration effect of Pump.fun’s strong cash flow, Launchpads evolved from simple tool platforms to “Ecosystem Liquidity Engines.” Competitors like Believe and Letsbonk emerged, competing for long-tail traffic by optimizing creator incentives, driving the prosperity of surrounding ecosystems like DEXs and aggregators.
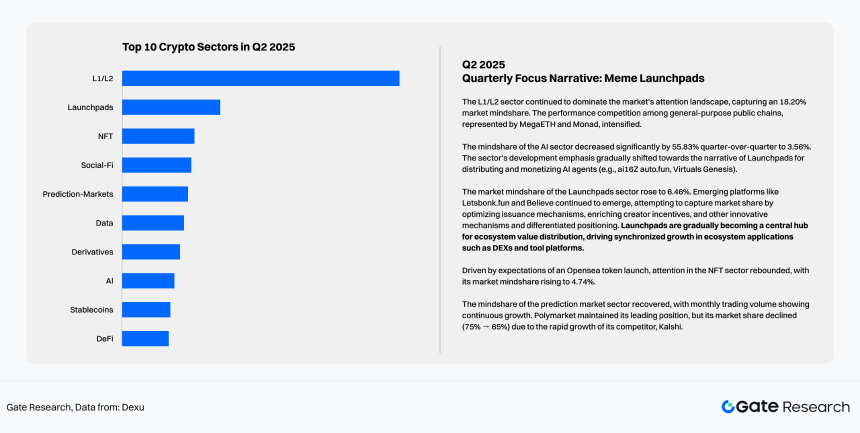
Chart 22: Top 10 Crypto Sectors in Q2 2025
Data Source:Dexu
4.3 Q3: Micro-Recovery of Stablecoin Chains and IDOs
- Keywords: Value Distribution Reconstruction, IDO Launchpads
- Logic Shift: The market began to reflect on the imbalance of benefit distribution between stablecoin issuers and underlying public chains. Trends of giants like Circle and Tether building their own chains drove the explosion of the “Stablecoin Chain” narrative (e.g., Plasma public sale selling out instantly).
- IDO Warm-up: Platforms like Buildpad, through compliant transformation, took over the capital vacuum after the Meme recession. The Launchpads sector showed a Divergent Trend from the Meme sector for the first time (i.e., Meme down, Launchpads up), indicating rigid market demand for “Primary Issuance of Quality Assets.”
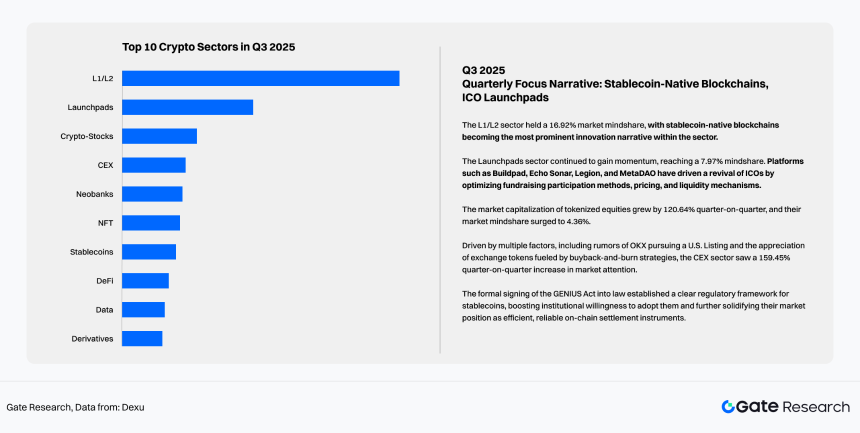
Chart 23: Top 10 Crypto Sectors in Q3 2025
Data Source:Dexu
4.4 Q4 (Oct-Nov): Trading and Privacy Game Under High Volatility
- Keywords: On-chain Derivatives, Prediction Markets, Privacy Return
- Performance: Derivatives sector ROI surged to 61.25% in October, with monthly on-chain volume hitting a historic peak of $1.37T.
-
Logic:
-
Perp Dex: The rise of projects like Aster validated the feasibility of high-performance on-chain matching, absorbing trading demand spilling over from CEXs.
- Prediction Markets: Polymarket and Kalshi formed a duopoly backed by Wall Street capital (like ICE), with monthly volume breaking ten billion, becoming a killer app for Web3 mainstream adoption.
- Privacy: Privacy-related sectors recorded significant excess returns (236.71% increase) during the sample period, reflecting that under the trend of regulatory transparency, some capital began increasing allocation to privacy-attributed assets.
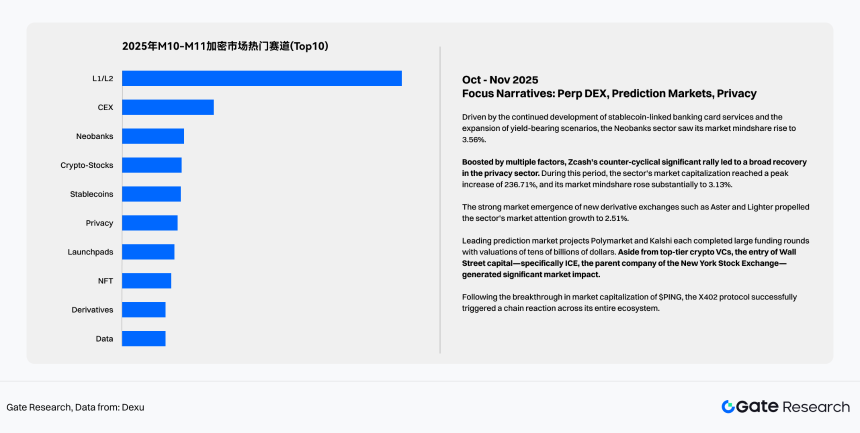
Chart 24: Top 10 Crypto Sectors in M10-M11 2025
Data Source:Dexu
III. Secondary Market: Market Structure and Trading Structure
Data cutoff for this chapter: Research report data as of November 11, 2025; Post-October 11 market data as of November 17, 2025; Memecoin-related data as of November 12, 2025; Statistics for Binance Alpha airdrop listed projects as of November 11, 2025.
1. Annual Overview: Surface “Sideways,” Underlying High Volatility and Multiple Structural Shifts
In 2025, influenced by factors such as macro expectations and policy changes, the crypto secondary market exhibited obvious high volatility and structural changes.
Total Market Cap decreased from $3.4T at the beginning of the year to the current $3.38T (as of Nov 17). While seemingly a slight pullback, it experienced an annualized volatility of 44% and multiple quarterly drawdowns exceeding 20%.
- As of Nov 12, BTC and ETH rose 14.57% and 7.9% respectively year-to-date, while Altcoins dropped 25.12% overall.
- As of Nov 17, the market cap dominance of BTC and Stablecoins rose to 58.36% and 8.54%, increasing by 3.72% and 2.7% respectively year-to-date, while ETH and other altcoins’ dominance decreased by 0.31% and 6.2%.
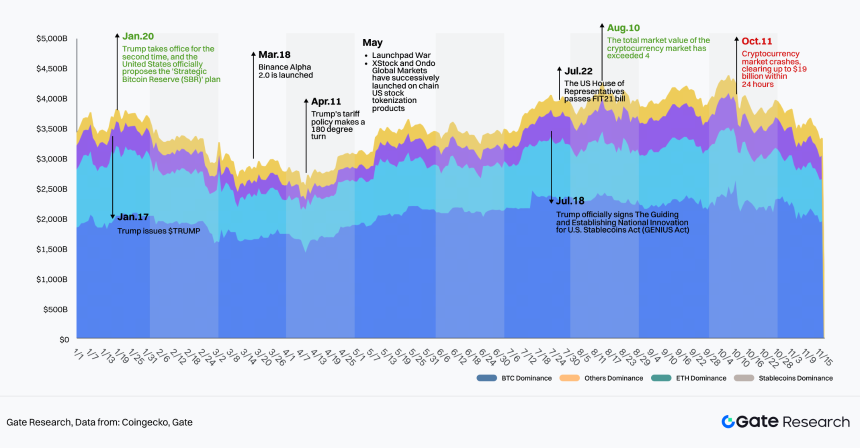
Chart 25: Changes in the Market Value Structure and Key Events of the Cryptocurrency Market in 2025
Data Source: Coingecko, Gate
1.1 Three Major Structural Characteristics of the 2025 Market
1.1.1 Significant Sector Rotation in Altcoins
Privacy, Real World Assets (RWA), and Perpetual sectors performed excellently throughout the year.
- After a general market decline in Q1, decentralized finance (DeFi) sectors like Perpetual, DEX, and Lending led the rise in Q2; in Q3, Layer2, Prediction Market, RWA, and Launchpad sectors performed best; in Q4, the Privacy sector’s rally was unrivaled.
- Overall market capitalization rose by 121.53%, 28.57%, and 10.77% respectively compared to the beginning of the year. Sectors like DePIN, Gaming, Layer2, Memecoin, and AI performed poorly, all dropping by over 40%.
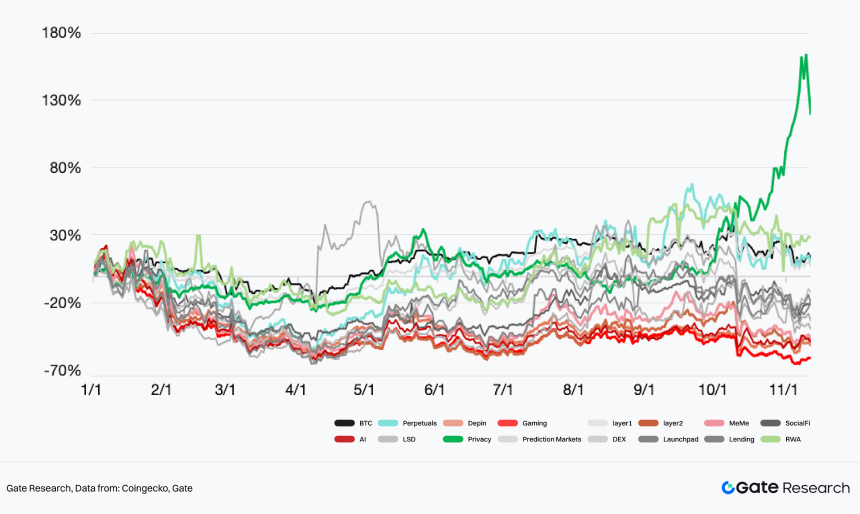
Chart 26: Performance of major tracks in the cryptocurrency market in 2025 (Daily return rate)
Data Source: Coingecko, Gate
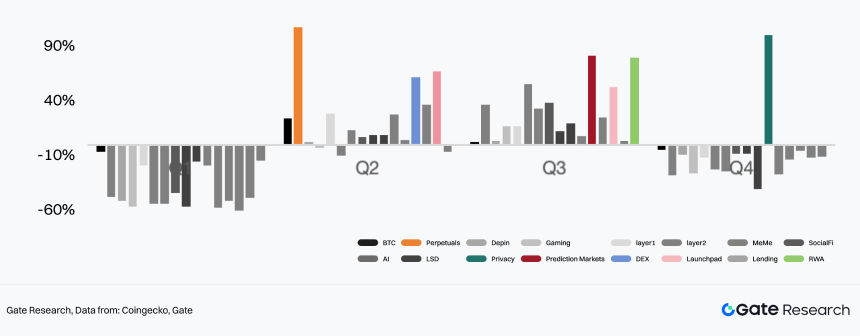
Chart 27: Performance of major tracks in the cryptocurrency market in 2025 (Quarterly return rate)
Data Source: Coingecko, Gate
1.1.2 Accelerated Integration of Crypto and Traditional Finance
Since 2025, the positive correlation between BTC price trends and US stocks has become increasingly obvious, and the mechanism for traditional capital inflow into crypto has been established and is trending towards scale.
- In 2025, the correlation of BTC price trends with QQQ (Nasdaq 100) and SPY (S&P 500) remained positive for long periods, reaching a strong correlation coefficient of 0.8 multiple times, a significant change from the cyclical positive/negative fluctuations in 2024.
- Since the approval of US BTC Spot ETFs, crypto assets purchased by US Spot ETFs have continued to rise. As of Nov 2025, the total net assets of US Spot ETFs reached around $150B. With more token ETFs gradually approved, more traditional funds will enter the crypto market, tightening the link between crypto and traditional financial markets.
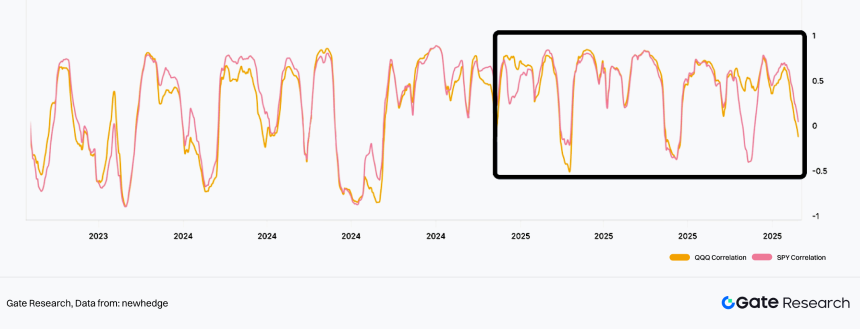
Chart 28: Bitcoin Correlations (QQQ, SPY)
Data Source: newhedge
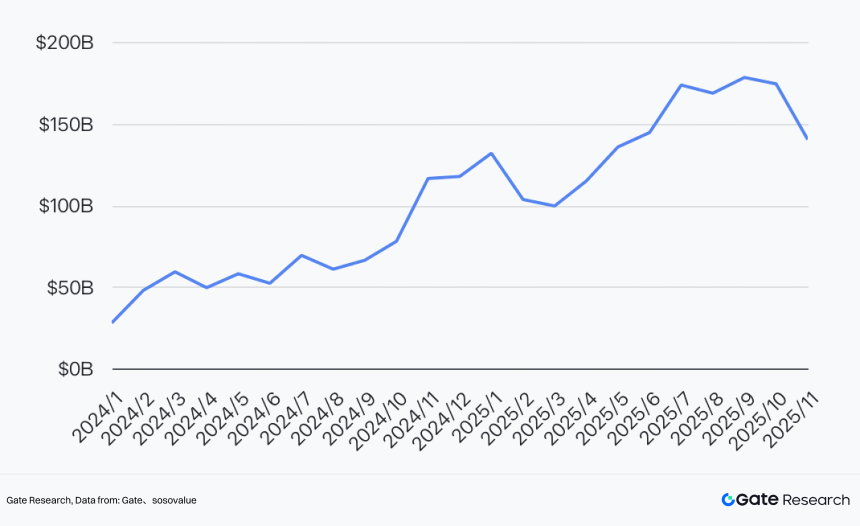
Chart 29: Net Assets of U.S. Spot ETFs: BTC, ETH, SOL, and XRP
Data Source: Sosovalue, Gate
1.1.3 The New Normal of Contract-Dominated Trading
In 2025, the average monthly daily trading volume (Spot + Futures) was $11.2T, with futures trading volume accounting for an average of 62.32% of the total. This represents a 2.13% increase from the beginning of the year.
Since early March, the share of futures trading volume continued to rise from an average of 56.5% in January to 67.65% in June. Although it began a fluctuating downward trend after June, it basically remained around 55%.
With increased market volatility and divergent investor behavior, market trading strategies gradually shifted to contracts (futures) to capture short-term opportunities rather than holding spot long-term.
- From Jan-Mar, the crypto market trended downward overall, BTC volatility increased significantly, and investor behavior diverged. Spot trading volume showed negative growth in all months except May, while futures trading volume rose steadily.
- After July, as regulatory trends and rate cut expectations became clearer, market volatility continued to decline. Spot demand began to grow, with transaction volume month-on-month growth rates gradually exceeding contracts, and the proportion of futures trading volume showed a downward trend.
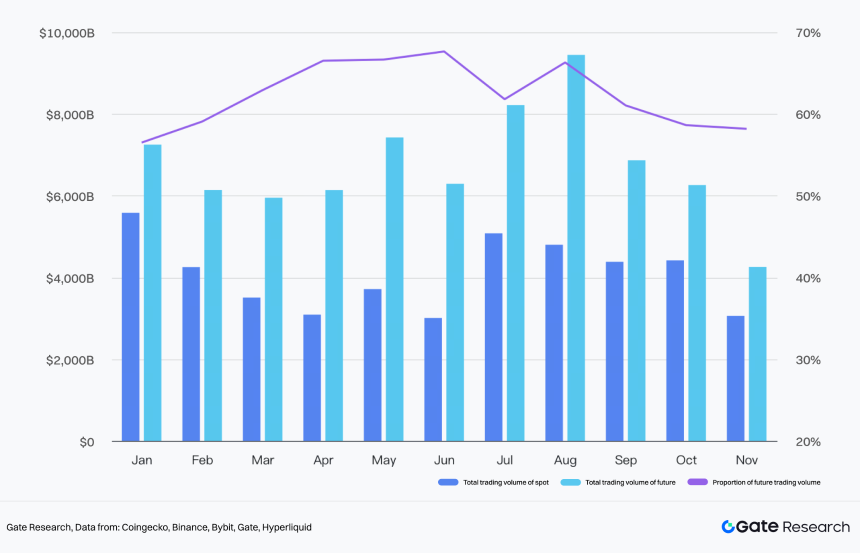
Chart 30: Total trading volume of the cryptocurrency market in 2025
Data Source: Coingecko(Contract trading volume data primarily selected from major exchanges such as Binance, Bybit, Gate, and Hyperliquid)
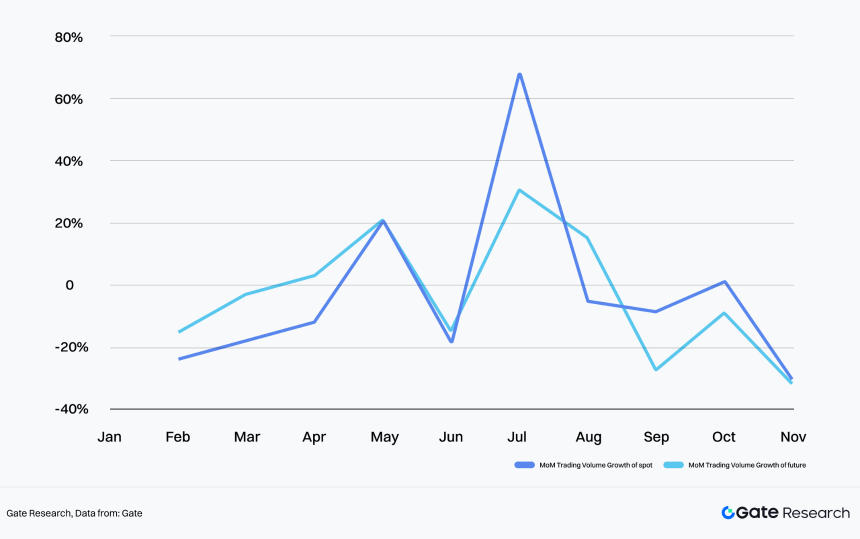
Chart 31: MoM Trading Volume Growth of spot and future trading volume in 2025
Data Source: Coingecko, Gate
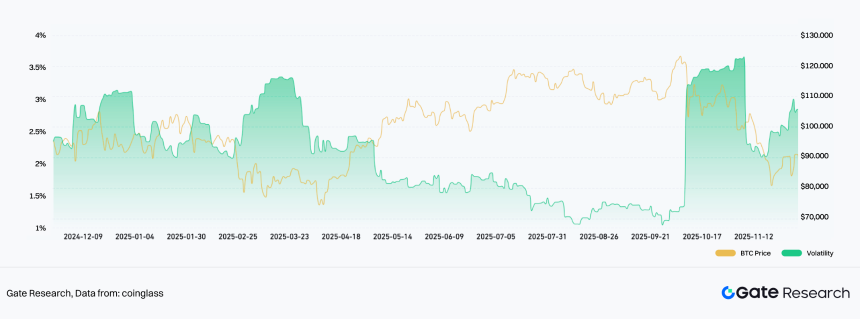
Chart 32: BTC Historical Volatility
Source From:Coinglass
1.2 2025 Secondary Market Review: Evolution from Macro Narrative to Structural Integration
2025 Q1: Macro Tightening and Policy Uncertainty Trigger Sharp Market Drop
Early in the year, the Fed’s pause on rate cuts and the Trump administration’s restart of tariffs triggered a global liquidity and supply chain crisis. The total crypto market cap fell sharply from a high of $3.8T, with a maximum drop of over 30%.
- US President Trump launching a personal token sparked a celebrity token issuance craze, rapidly draining market liquidity.
- Altcoins were the first to correct, with market share dropping from a high of 32.35% to 20.43%.
- Safe-haven and highly liquid assets became dominant, with BTC share rising to 60%+ and stablecoin scale rising synchronously.
- Binance launched Alpha 2.0, gradually influencing the market landscape deeply.
2025 Q2: Fed Rate Cut Expectations Return, Trump Tariff Policy Softens, Market Shifts from Rising Volatility to Steady Recovery
The Fed’s “dovish” signals reignited liquidity expectations, and Trump’s 180-degree turn on tariff policy was seen as a macro directional easing signal, becoming a turning point for market sentiment. The crypto market began a steady recovery, with a maximum quarterly gain of over 45%.
- BTC, ETH, and stablecoin market caps recovered steadily.
- DeFi led the market, with Perpetual and Lending sectors rising 104.5% and 65.2% respectively.
- The RWA ecosystem was poised for action, with Ondo & Xstock on-chain stocks emerging.
- Memecoins on Sol, BSC, etc., heated up again, with the Launchpad sector rising over 35.23%.
2025 Q3: Fed Rate Cut Imminent, Crypto Market Structural Trend Confirmed
With the Fed rate cut imminent, the market structural trend was confirmed. Total market cap broke $4T, reaching the year’s highest point.
- BTC and ETH prices both hit historical highs. ETH led the market.
- ETH Spot ETF inflows exceeded BTC, with a net inflow of $9.58B in a single quarter. Massive buying by coin-stock companies like SharpLink and BitMine pushed ETH’s market share to 12.61%.
- The RWA sector exploded, rising 77.26% in a single quarter. On-chain US stocks and bonds formed a real yield asset pool, and stablecoin market cap broke $28B.
- On-chain Perpetual dominance strengthened, with Hyperliquid trading volume market share continuing to grow.
2025 Q4: Market Flash Crash Triggers Leverage Clearing, Accelerated Integration of Crypto and TradFi
On October 11, the market flashed crashed, with a 24-hour liquidation scale reaching $19B. High leverage positions were wiped out en masse, and market cap fell back to the current (Nov 17) $3.28T, entering a downward channel.
- The market entered a defensive phase of low liquidity; mainstream token market depth and OI holdings both showed significant declines.
- The 30-day correlation between BTC and the Nasdaq 100 Index remained highly positive, tightening the link between crypto and traditional financial markets.
- The Privacy sector began a sustained rise from late September and accelerated after the Oct 11 flash crash, with YTD highs exceeding 150%.
2. Deep Dive into Key Events: Viewing Overall Logic through Local Changes
2.1 From Frenzy to Cooling: Memecoin Sector Shows Zero-Sum Game After Wealth Effect Fades
At the beginning of the year, the AI Memecoin craze combined with US President Trump’s token issuance attracted a massive influx of new users and funds due to the huge wealth effect and exposure. However, the subsequent sharp drop cooled the market rapidly.
In May, intense competition among Launchpads primarily on the Sol chain (Pump.fun, bonk.fun, Believe) birthed high-market-cap Memecoins like $USELESS, whose fair participation and wealth effect attracted many investors.
Memecoins currently belong to assets with lower priority in crypto market liquidity preferences, showing poor overall trends.
- As of Nov 12, Memecoin market cap dropped 45.51% from the beginning of the year. After the Q1 crash, rebounds in Q2 and Q3 were very weak.
- Memecoins’ share of total crypto market cap continues to decline, currently only 1.6%, a decrease of 1.46% from the start of the year, with the decline in share significantly exceeding the overall altcoin sector drop.
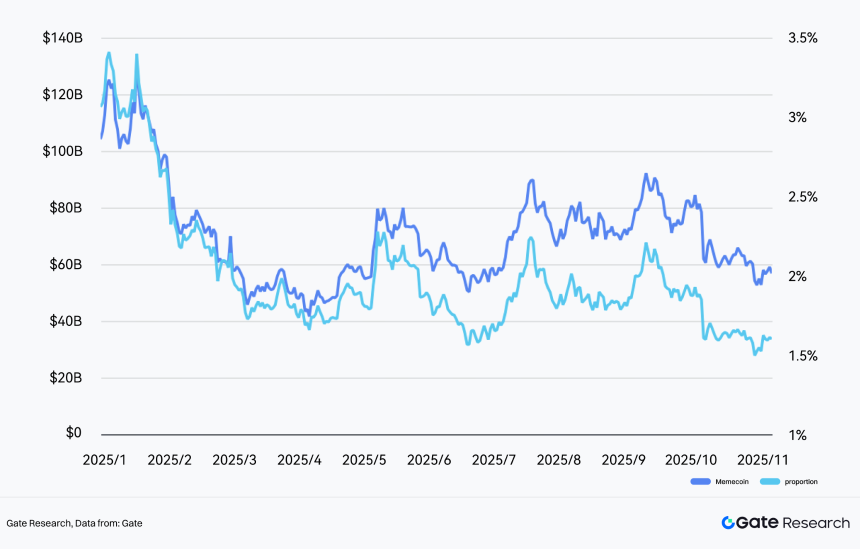
Chart 33: Top Memecoin Market Cap and Percentage of Total Crypto Market Capitalization
Data from:Coingecko, Gate
On-chain speculative demand still exists, but the zero-sum competition is becoming fiercer (using Solana chain data, where Memecoin creation and trading are most active, as a reference).
- Revenue from Solana Launchpads like Pump.fun and Bonk.fun remained around $60M monthly from February to September, except for market crashes in Jan and Oct. Even in Oct, affected by the market drop, it still had $40M. This indicates that on-chain token deployment and trading remain at a decent level.
- Since April, multiple new Solana ecosystem Launchpads like Bonk.fun, Boop, Believe, Moonshot Create, and Jup Studio have emerged, competing fiercely with pump.fun. However, this competition did not bring incremental liquidity to the chain. The trading volume of on-chain DEX Memecoins, the number of New Tokens deployed, and the number of active addresses are all in a fluctuating decline.
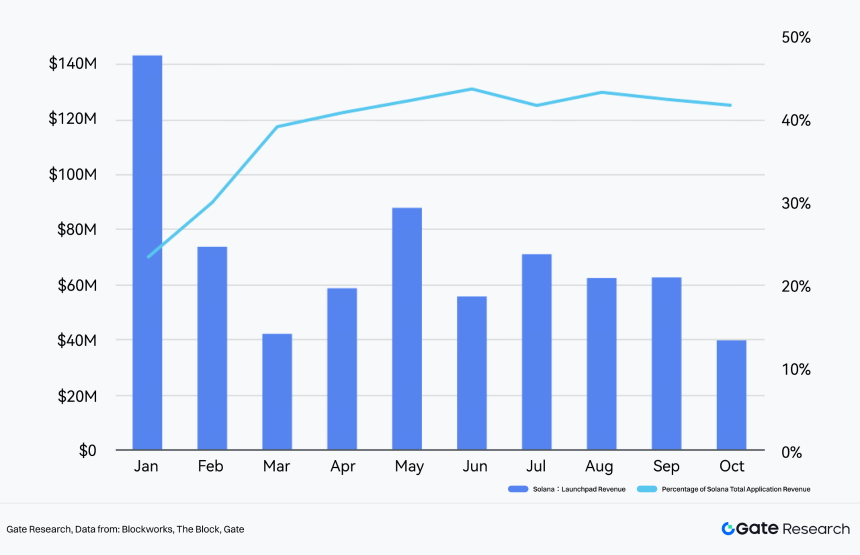
Chart 34: Solana Launchpad Revenue
Date From:Blockworks,The Block,Gate
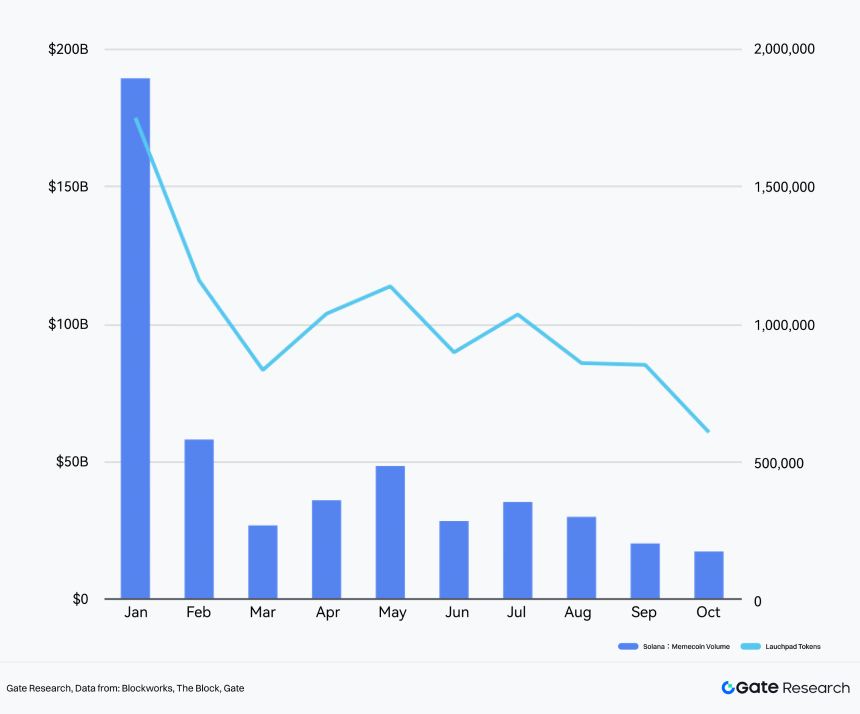
Chart 35: Solana DEX Memecoins Volume and Lauchpad Tokens
Date From:Blockworks, The Block, Gate
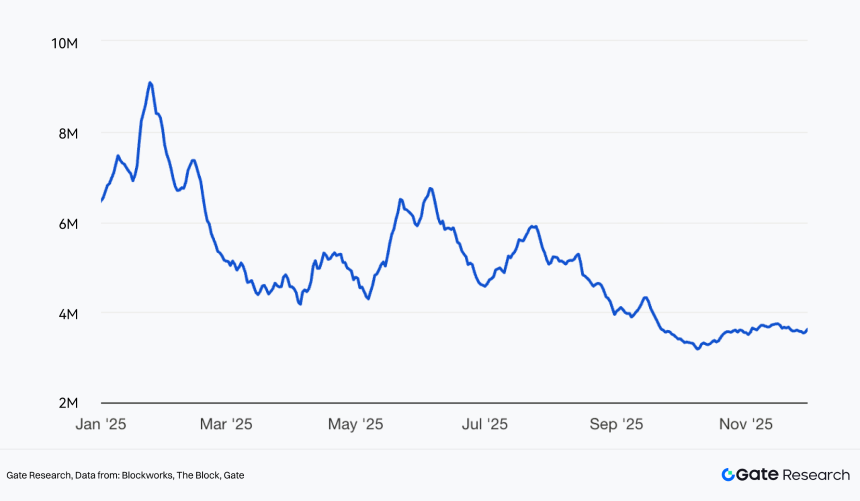
Chart 36: Number of Active Addresses on the Solana Network (Daily, 7DMA)
Data Source:Blockworks, The Block, Gate
2.2 Binance Alpha 2.0 Reshaping Primary and Secondary Market Landscape
In March 2025, Binance Alpha 2.0 went live, breaking the liquidity barrier between on-chain and CEX. Its subsequent launch of trading points + exclusive airdrop/TGE mechanisms created an ecosystem loop where users, projects, and the exchange all win, drastically changing the landscape of primary and secondary markets.
Secondary market liquidity is further concentrating on Binance Alpha.
- Among TGE projects in 2025 with market cap >$20M, 67.29% chose to airdrop/list on Binance Alpha (rising to 74.77% if including direct Binance listings).
- Spot trading volume of projects listed on Binance Alpha accounts for an average of 42.13% of total network spot volume, making it one of the core trading venues for new tokens.
Listing pace on Binance Alpha accelerated, intensifying market cap competition.
- As of Nov 11, a cumulative 265 projects were airdropped/listed, with quarterly data showing a clear acceleration: Q2: 73 → Q3: 127→ Q4 (first half only): 61.
- Nearly half of projects listed on Binance Alpha subsequently listed futures contracts, while only 19.23% listed spot.
- Intensified Market Competition: The average 1-day gain for tokens listed on Binance Alpha was negative for all, with declines widening quarter by quarter; the 30-day average gain improved from -51.74% in Q1 to -36.91% in Q4, with the probability of rising hovering consistently around 30%.
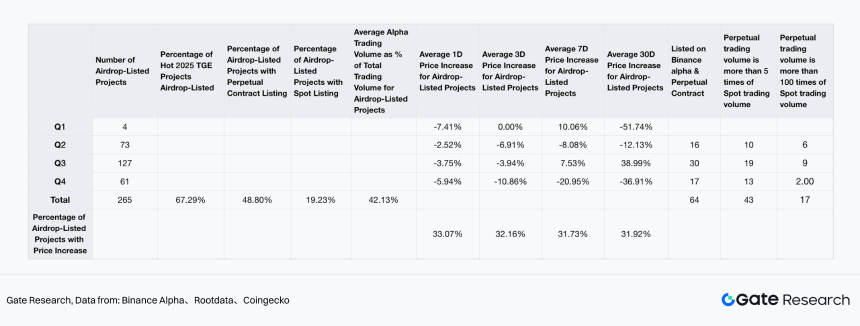
Chart 37: Binance Alpha list Project Performance
Data Source:Binance Alpha、Rootdata、Coingecko Binance alpha空投上线项目统计
Futures trading clearly dominates the Alpha market structure (for projects listed on both Alpha + Futures).
- For projects listed on both (64 projects), futures volume averaged 179 times that of Alpha, far higher than traditionally listed projects.
- 43 projects had futures volume > 5x Alpha; 17 projects had futures volume > 100x Alpha.
(Note: Statistics as of Nov 11, covering only projects listed on both Binance Alpha and Futures. Projects with extremely high spot volume due to users farming Binance Alpha points were excluded.)
2.3 Rise of On-Chain Stock Trading: Traditional Finance and Crypto Market Enter Deep Integration Phase
In May, xStock and Ondo Global Markets successively launched on-chain tokenized stock products, initially covering 60+ Nasdaq core constituents and S&P leaders, achieving 1:1 anchoring to real shares, 24/5 instant settlement, and cross-chain transferability. Mainstream exchanges like Bybit, Kraken, and Gate quickly provided support, listing xStock spot and futures first. Binance Wallet, Bitget Wallet, and others subsequently launched “One-click Buy On-chain Stocks” functions.
The market rapidly presented structural changes driven by real capital:
-
RWA Total Value Locked (TVL) Explosion: In May alone, RWA TVL grew 11.64% month-on-month; as of Dec 1, RWA TVL was $16.32B, up over 60% from early May. RWA’s share of total DeFi TVL rose from 10% at the start of the year to around 15%.
-
TradFi (Traditional Finance) Capital Injection:
- Tokenized stocks sub-sector TVL grew from $383M in May to $660M currently (+72%). Ondo and xStock contributed over 75%, with cumulative volume (CEX + DEX) of $12.2B and $1.3B** respectively, led by Tesla, Circle, NVIDIA, and S&P 500 ETF tokens.
- BlackRock’s Ethereum on-chain USD liquidity fund (BUIDL) saw its TVL soar from $600M in early 2025 to a peak of $2.9B**. Currently, exchanges/DeFi protocols like Binance and Aave support BUIDL as collateral for lending.
-
Crypto Native Capital Reallocation:
- The current ETH staking total reached 35 million (28% of total supply), trending up since the start of the year, with TVL over $45B (+150%). Capital flowed out of high-Beta altcoins towards LSTs (Liquid Staking Tokens) like stETH to capture staking yields.
- Yield pools like Lido, Aave, and Ethena saw TVL growth of over 20% this year, with Aave growing over 100% at its peak.
Conclusion: Capital sources show two distinct streams: On one hand, TradFi capital injects into on-chain stocks via platforms like Ondo Finance seeking 24/7 trading and instant settlement; on the other hand, crypto native capital is shifting from high-Beta speculative assets to “yield-bearing asset pools” with real cash flow and regulatory backstops. This means the crypto market’s asset structure is transforming from being purely “crypto-native narrative driven” to “hybrid asset and real yield driven.”
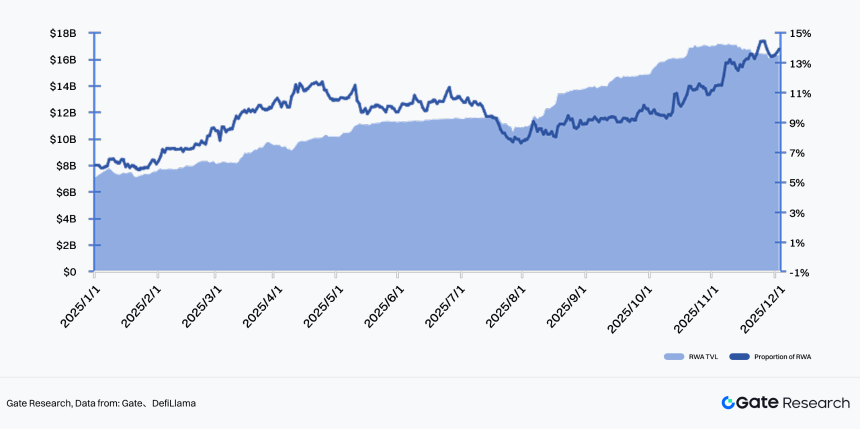
Chart 38: Trend chart of RWA TVL and percentage of DeFi total TVL in 2025
*Data From:DefiLlama, GATE
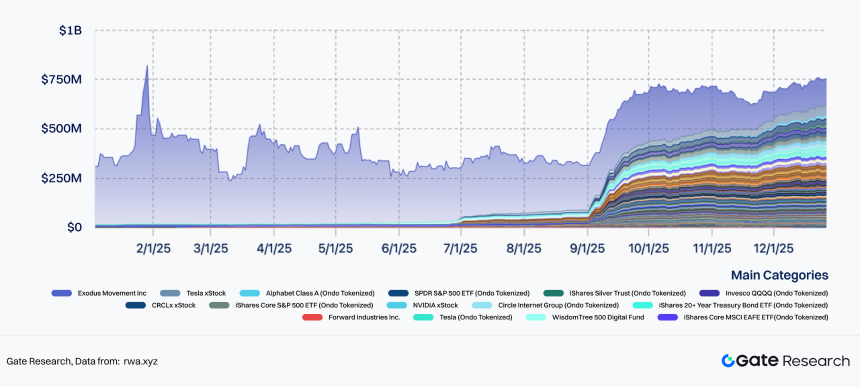
Chart 39: Changes in TVL of the Monetized US Stock Market in 2025
Data From:rwa.xyz
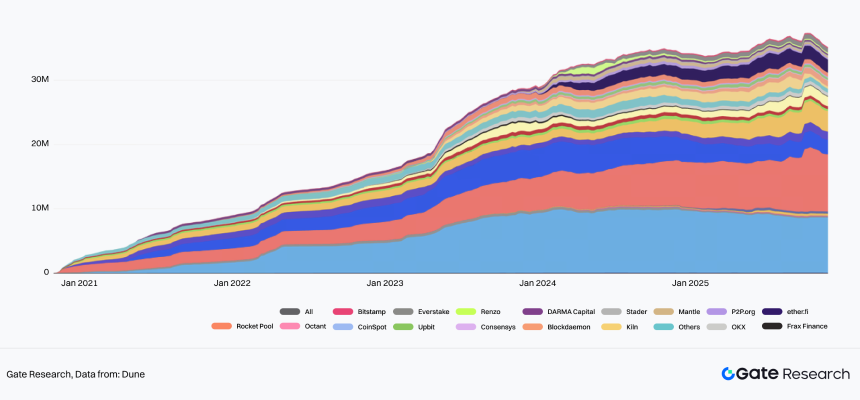
Chart 40: Changes in the total amount of ETH staking
Data Source:Dune
2.4 Hyperliquid Rise: On-Chain Perps Thoroughly Ignited
In the second half of the year, Hyperliquid, relying on a fully on-chain matching architecture, non-custodial and KYC-free user experience, and low slippage/high performance matching comparable to CEXs, ascended to become one of the top five global derivatives trading platforms. Against the backdrop of frequent CEX blowups and lack of audits, the “Self-Custody + No Centralized Counterparty Risk” attribute made it a primary destination for high-leverage traders migrating on-chain.
$HYPE Strong Resilience:
- Hyperliquid’s native token $HYPE rose from $40 in early August to an All-Time High (ATH) of $58.53 on Sep 19, a gain of +46.3%.
- It retraced about 36% after the 10.11 flash crash but repaired rapidly, currently maintaining a high of $30+, demonstrating strong resilience.
Platform TVL Explosion:
- Platform TVL exploded from $2.3B in May to the current $4.35B, nearly doubling.
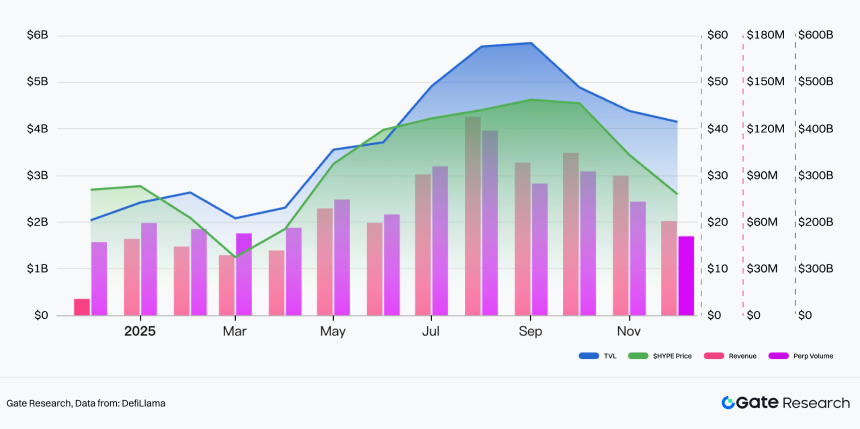
Chart 41: The price trend, platform TVL, revenue, and Perp Vol of Hyperliquid native token $HYPE
Data Source:Defilama
Volume Firmly Leading DEX Derivatives:
- In 2025, Hyperliquid’s single-platform cumulative Perps volume reached $3.40T. Current 30d Perps Vol is $249.6B, accounting for 18.8% of total Perps volume and 64.8% of total DEX volume, firmly occupying the top spot in DEX derivatives.
- The ratio of Hyperliquid futures volume to Binance futures volume rose from 2.52% at the start of the year to 10+%.
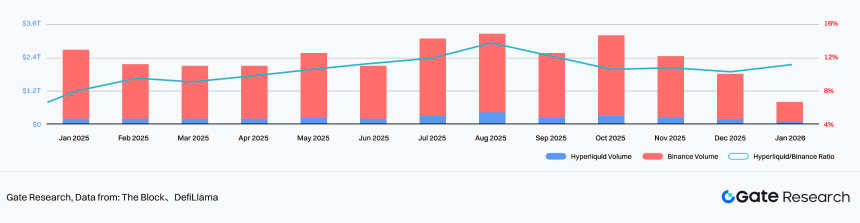
Chart 42: Comparison of trading volume between Hyperliquid and Binance futures
Date from: The block, DefiLlama
On-Chain Perps Devouring CEX Share:
- The ratio of DEX futures volume to the global total futures market showed rapid growth, reaching 14.11% by October, an increase of 9.16% from the beginning of the year.
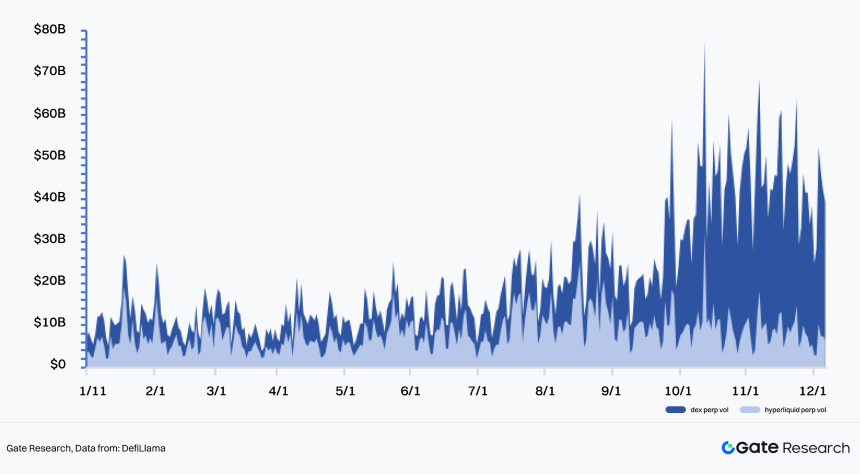
Chart 43: Comparison of perp trading volume between Hyperliquid and DEX (total)
Data From:DefiLlama
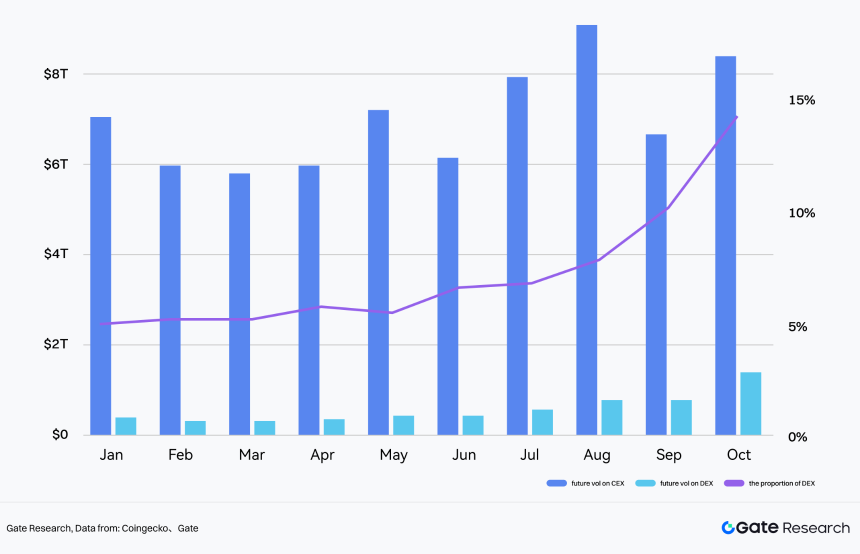
Chart 44: Comparison of monthly future trading volume between CEX and DEX
Data From:Coingecko,Gate
Benefiting from advantages in performance, on-chain execution transparency, and user experience, on-chain Perps markets represented by Hyperliquid achieved explosive growth in 2025 and gradually eroded CEX market share, showing a trend of on-chain perps moving from the fringe to the mainstream.
Overall, user preference for high-performance, transparent execution environments is reshaping the derivatives market landscape. While on-chain Perps are expected to maintain high growth, one must be wary of dual risks from Regulation and Liquidity (the 10.11 flash crash warned of liquidity risks under extreme conditions).
2.5 Micro Liquidity Indicators: Market Hollows Out and OI Contracts After 10.11 Flash Crash
On October 11, Trump’s tariff statement triggered global risk-off panic, crashing the crypto market: BTC plunged 15% in the short term, Binance had an outage, USDE de-pegged, further amplifying chain reactions. Within 24 hours, network-wide liquidations soared to a record $19B.
Market Depth (how much buying/selling volume the current price can withstand without significant movement, directly reflecting real liquidity) declined significantly, exposing the crypto market to risks of violent price fluctuations.
- BTC depth continued to decline with weak rebound: In early October, the average cumulative depth of BTC on major trading platforms (1% from mid-price) was close to $20M. However, this indicator plummeted by nearly one-third on Oct 11 and showed almost no rebound subsequently.
- Altcoins rebounded from panic but have not recovered to previous strength: The 1% depth for altcoins shrank rapidly from nearly $2.5M to around $1M. Although it rebounded to around $1.8M by Nov 11, overall liquidity remains poor.
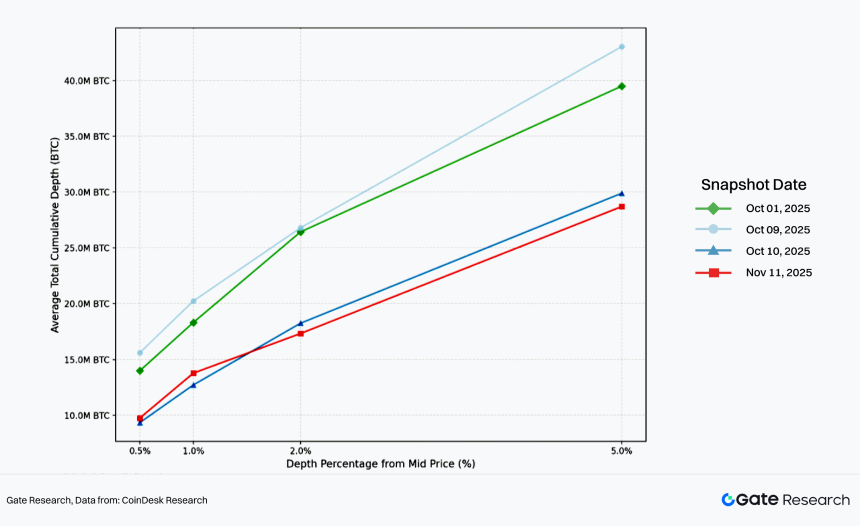
Chat 45: BTC Average Total Liquidity Comparison by Date
Data From:Coindesk Research
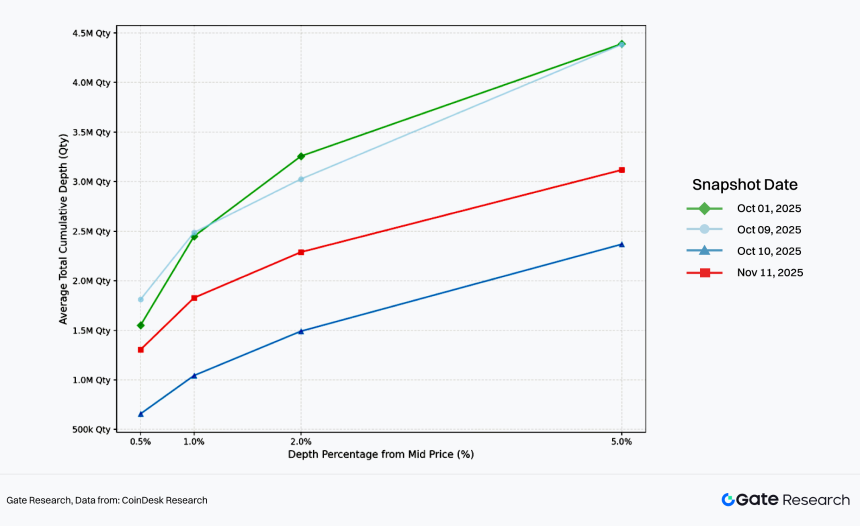
Chat 46: Alts (SOL/XRP/ATOM/ENS) Average Total Liquidity Comparison by Date
Data From:Coindesk Research
Futures Open Interest (OI) Dropped Sharped and Continues to Decrease:
- Since the Oct 11 flash crash, BTC Open Interest (OI) on mainstream exchanges dropped sharply from a daily average of around $90B to around $60B, and remains in a downward trend.
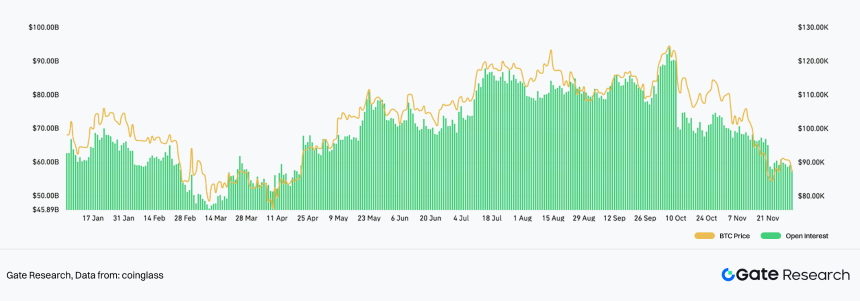
Chart 47: Exchange BTC Open Interest (USD)
Data From:Coinglass
Market Speculative Demand Remains Strong:
Although futures OI decreased, overall futures trading volume did not differ significantly from the period before Oct 11. The futures-to-spot ratio, total futures volume ratio, and daily futures volume changes did not show significant changes, indicating that the Oct 11 flash crash did not cause structural impact on trading in the futures market.
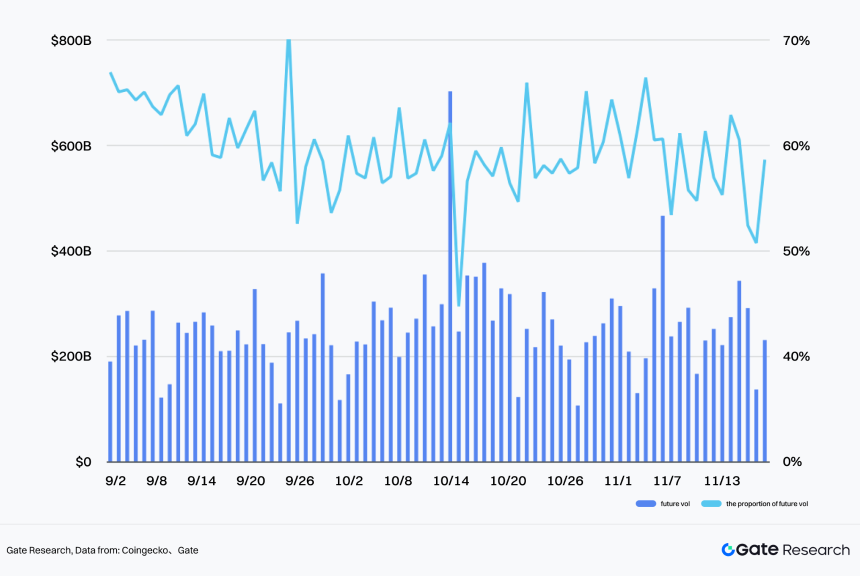
Chart 48: The futures trading volume data in the cryptocurrency market since September 2025
Data From:Coingecko、gate
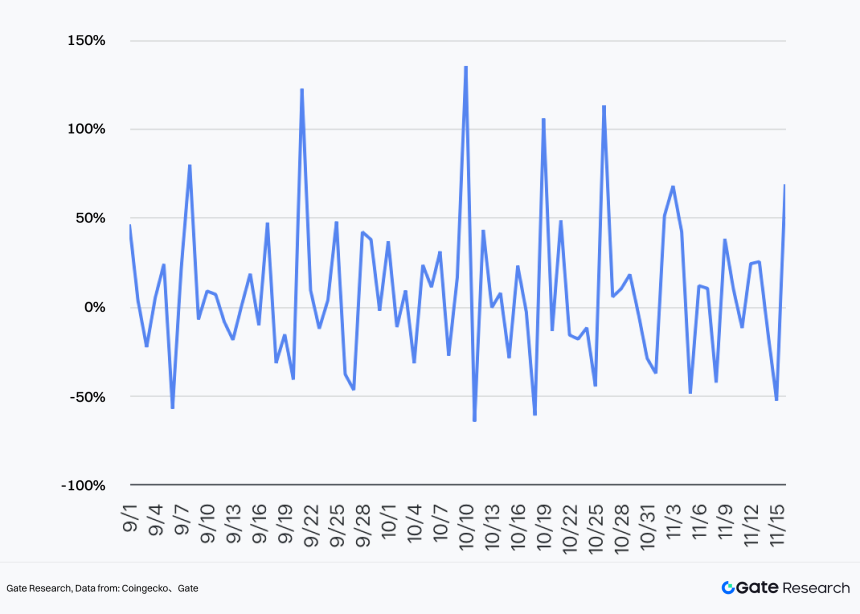
Chart 49: The daily trading volume change of futures in the cryptocurrency market since September 2025
Date From:Coingecko,Gate
IV. Incremental Logic and Emerging Sectors: New Reservoirs for Liquidity
Core Logic: In a macro environment where high inflation recedes but fiscal deficits remain high and geopolitical uncertainties exist, asset allocation behavior shows distinct differentiation. Meanwhile, the Web3 ecosystem did not see the expected “liquidity flood.” The 2025 crypto market is characterized by “Structural Migration Under Aggregate Scarcity”—liquidity is settling from pure narrative bubbles into sectors capable of Real Yield and financial infrastructure functions.
1. On-Chain Liquidity: “Safe-Haven and Yield-Bearing” in a Zero-Sum Game
- Aggregate Feature: The simple logic of “Rate Cuts = Bull Market” failed on-chain. Network-wide TVL annual growth was only +4.4%. Big money did not flow to high-risk protocols but prioritized Gold and traditional tech stocks (AI).
- Structural Highlight: The RWA/Stablecoin sector carved an independent path, maintaining high speed growth for three years, ranking second in the industry with $9.42B net inflow in 2025.
- Evolution Direction: This data confirms that on-chain demand is shifting from “Trading Games” to “Compliant Yield” and “Payment Settlement (PayFi).” Stablecoins are no longer just safe havens but core infrastructure bridging the real world (Treasury yields) and on-chain financial interoperability.
2. Primary Market Liquidity: V-Shaped Reversal and Sector Rotation
- Capital Return: The primary market showed a significant V-shaped reversal. As macro uncertainty cleared, capital accelerated its return, with October financing alone reaching $3.6B, exceeding Q2/Q3 quarterly levels.
- Sector Siphoning: DeFi remains the king of fundraising, with $2.39B in October alone, showing continued capital bets on financial infrastructure innovation.
- Narrative Iteration: Capital switched rapidly between hotspots, forming a clear rotation path: from early-year AI (DeFAI) to mid-year Launchpad/Meme, and finally to year-end Stablecoin Chains, Perp DEXs, Privacy, and Prediction Markets. This indicates the primary market is trying to find a new balance between “Traffic Entry Points” and “High-Frequency Trading Scenarios.”
3. Secondary Market Liquidity: Stratification Intensifies and Derivatives Rise
-
Market Cap Performance: The market presents “Robust Indices, Bleeding Long-Tail.” As of Nov 17, total crypto market cap oscillates narrowly between $3.4T and $3.38T. Only BTC (+14.57%) and ETH (+7.9%) achieved annual gains. Overall market depth (BTC down 1/3, Altcoin 1% depth down from $2.5M to $1M) and futures OI ($90B down to $60B) dropped sharply following the Oct 11 flash crash, with many altcoins facing liquidity exhaustion.
-
Microstructure Innovation: Liquidity is shifting to more efficient trading forms:
- a. Asset Transition Mechanism: The “Binance Alpha >> Futures >> Spot” project “gauntlet run” has become the main funnel for liquidity screening.
- b. On-Chain Derivatives Explosion: On-chain trading experience improved drastically. Hyperliquid and other top protocols saw their futures volume ratio to Binance soar from 2.52% to 10%+, with competitors like Aster emerging, reshaping the “DEX vs CEX” competitive landscape.
- c. *Asset Forms: Exploration of on-chain stocks and RWA assets further enriched secondary market trading targets.
V. 2026 Market Outlook: From “Volatility-Driven” to “Structure-Driven” New Cycle
The key variable for the market in 2026 is no longer simply the “magnitude of rate cuts,” but “whether liquidity can be effectively transmitted to risk assets through compliant channels.” The market will bid farewell to the “Volatility-Driven” mode of the wild era and enter a “Structure-Driven” new cycle dominated by institutional pricing power and compliant asset pools.
1. Dual Drive of Macro and Policy
- Liquidity Transmission: If the Fed’s rate cut cycle is accompanied by an economic soft landing, risk appetite is expected to be substantially repaired.
- Compliance Cornerstone: With the implementation of the US GENIUS Act and EU MiCA frameworks, entry barriers for traditional institutions will be cleared legally. Sustained ETF net inflows will no longer be short-term hotspots but long-term Cornerstones supporting a bull market.
2. The Great Bifurcation of Asset Structure
- Matthew Effect: The market will further polarize. The market cap dominance of BTC and Stablecoins will continue to expand, serving as the system’s ballast.
- Survival of the Fittest: Only sectors with substantial technological implementation or revenue-generating capabilities (Cash Flow) (like RWA, Prediction Markets, DeFi) can continuously sustain institutional and retail funds. Long-tail altcoins lacking business logic support will face irreversible liquidity exhaustion.
3. “Derivatization” of Market Microstructure
- Pricing Power Transfer: It is expected that by 2026, the proportion of futures trading will gradually climb to 70%. Institutions will widely use on-chain perpetual contracts for hedging and Basis Trading, meaning spot prices will gradually shift to a process dominated by the derivatives market.
- Risk Warning: The 10.11 flash crash has sounded the alarm—in on a market dominated by high leverage, instant exhaustion of liquidity depth (Liquidity Fragility) will be a major systemic risk in the new normal. One must be wary of extreme volatility caused by “deleveraging.”
Note: This report revolves around the core variable of “Liquidity,” unfolding from three levels: Macro Liquidity (Monetary Policy & Risk Appetite), Market Liquidity (Primary Financing Scale & Trends, Secondary Trading Depth & Pricing Mechanisms), and On-Chain Liquidity (TVL & Stablecoin/RWA Sedimentation). To avoid bias from “single indicator explanation,” we simultaneously observed: Market Structure (Market Share, Sector Rotation), Trading Behavior (Spot/Futures Ratio, OI & Liquidations), and Capital Supply (ETF Inflows, VC Financing, Stablecoin Supply & RWA TVL). Data sources are primarily public data from Coingecko, DefiLlama, RootData, Dune, The Block, CoinGlass, etc., cited in the original draft; some key conclusions are cited from third-party institutional annual reports.